## Heatmap: Longer Inferences
### Overview
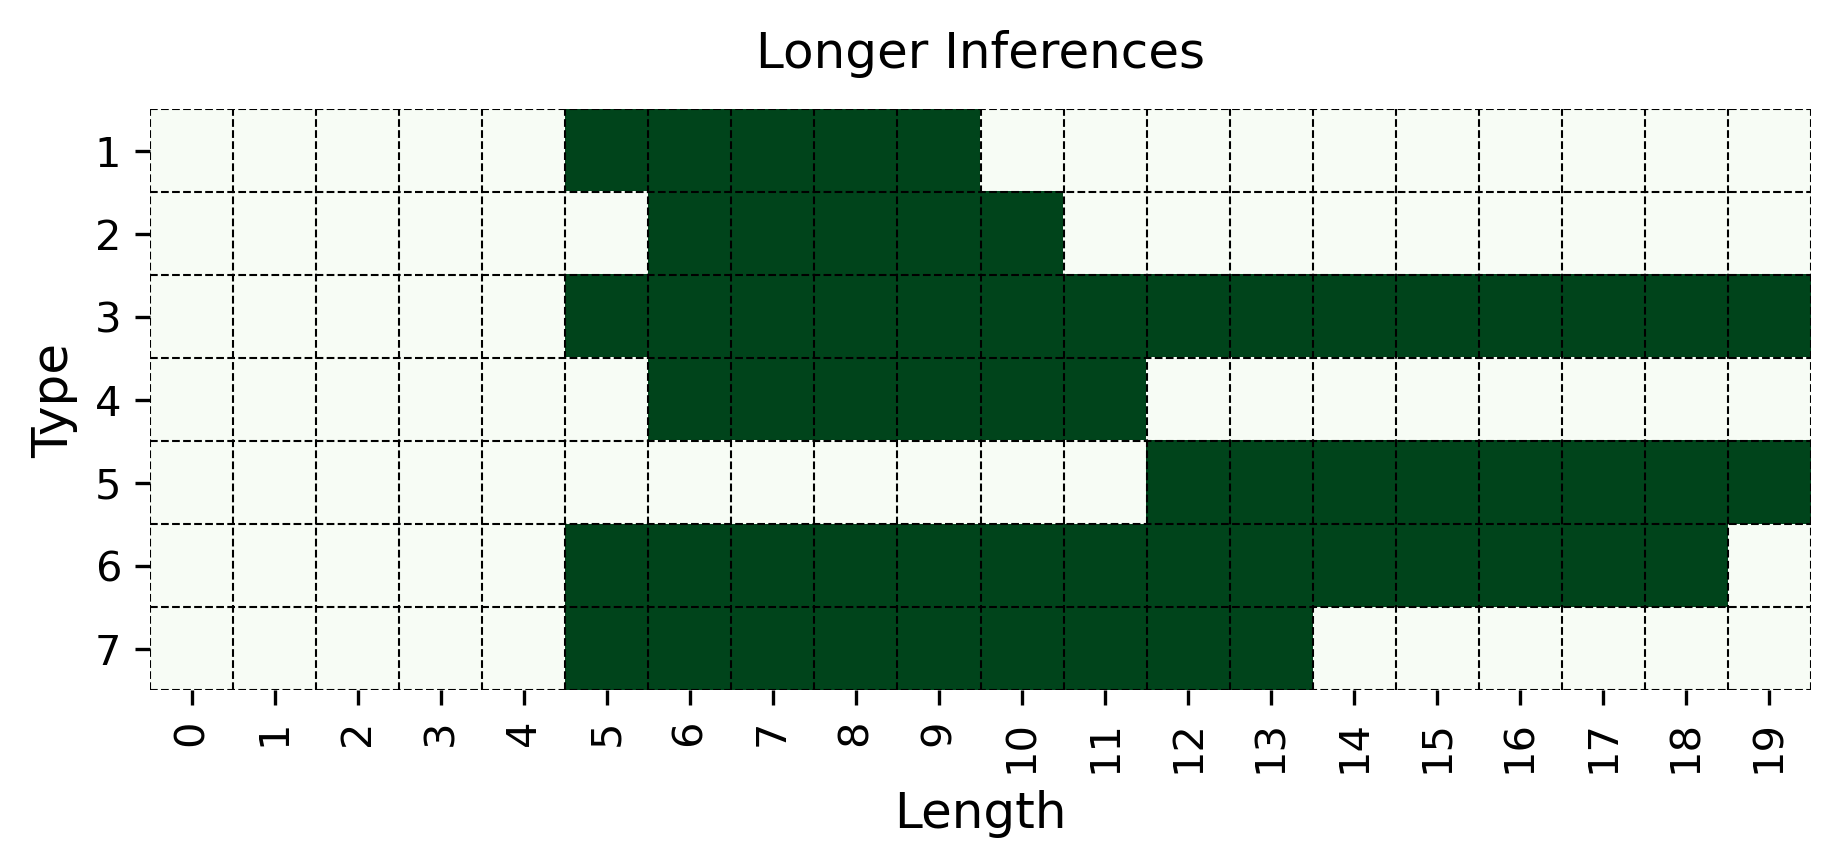
The image is a heatmap titled "Longer Inferences". It visualizes the relationship between "Type" (ranging from 1 to 7) and "Length" (ranging from 0 to 19). Dark green cells indicate a positive association or presence, while light green cells indicate absence or a negative association.
### Components/Axes
* **Title:** Longer Inferences
* **X-axis:** Length, with values from 0 to 19.
* **Y-axis:** Type, with values from 1 to 7.
* **Color Scheme:**
* Dark Green: Indicates a positive association.
* Light Green: Indicates a negative association.
### Detailed Analysis
The heatmap shows which "Type" is associated with which "Length".
* **Type 1:** Dark green from Length 5 to Length 11.
* **Type 2:** Dark green from Length 5 to Length 12.
* **Type 3:** Dark green from Length 4 to Length 19.
* **Type 4:** Dark green from Length 5 to Length 14.
* **Type 5:** Dark green from Length 12 to Length 19.
* **Type 6:** Dark green from Length 5 to Length 18.
* **Type 7:** Dark green from Length 13 to Length 18.
### Key Observations
* Types 3 and 5 have the longest continuous stretches of positive association.
* Types 1 and 2 have the shortest continuous stretches of positive association.
* No type has a positive association for lengths 0-4.
### Interpretation
The heatmap visualizes the "length" of different "types" of inferences. The dark green cells indicate the range of lengths for which a particular type of inference is valid or present. The data suggests that some types of inferences are consistently longer (Type 3 and 5), while others are shorter (Type 1 and 2). The absence of any dark green cells for lengths 0-4 indicates that all types of inferences require a minimum length of 5.