\n
## Heatmap: Longer Inferences
### Overview
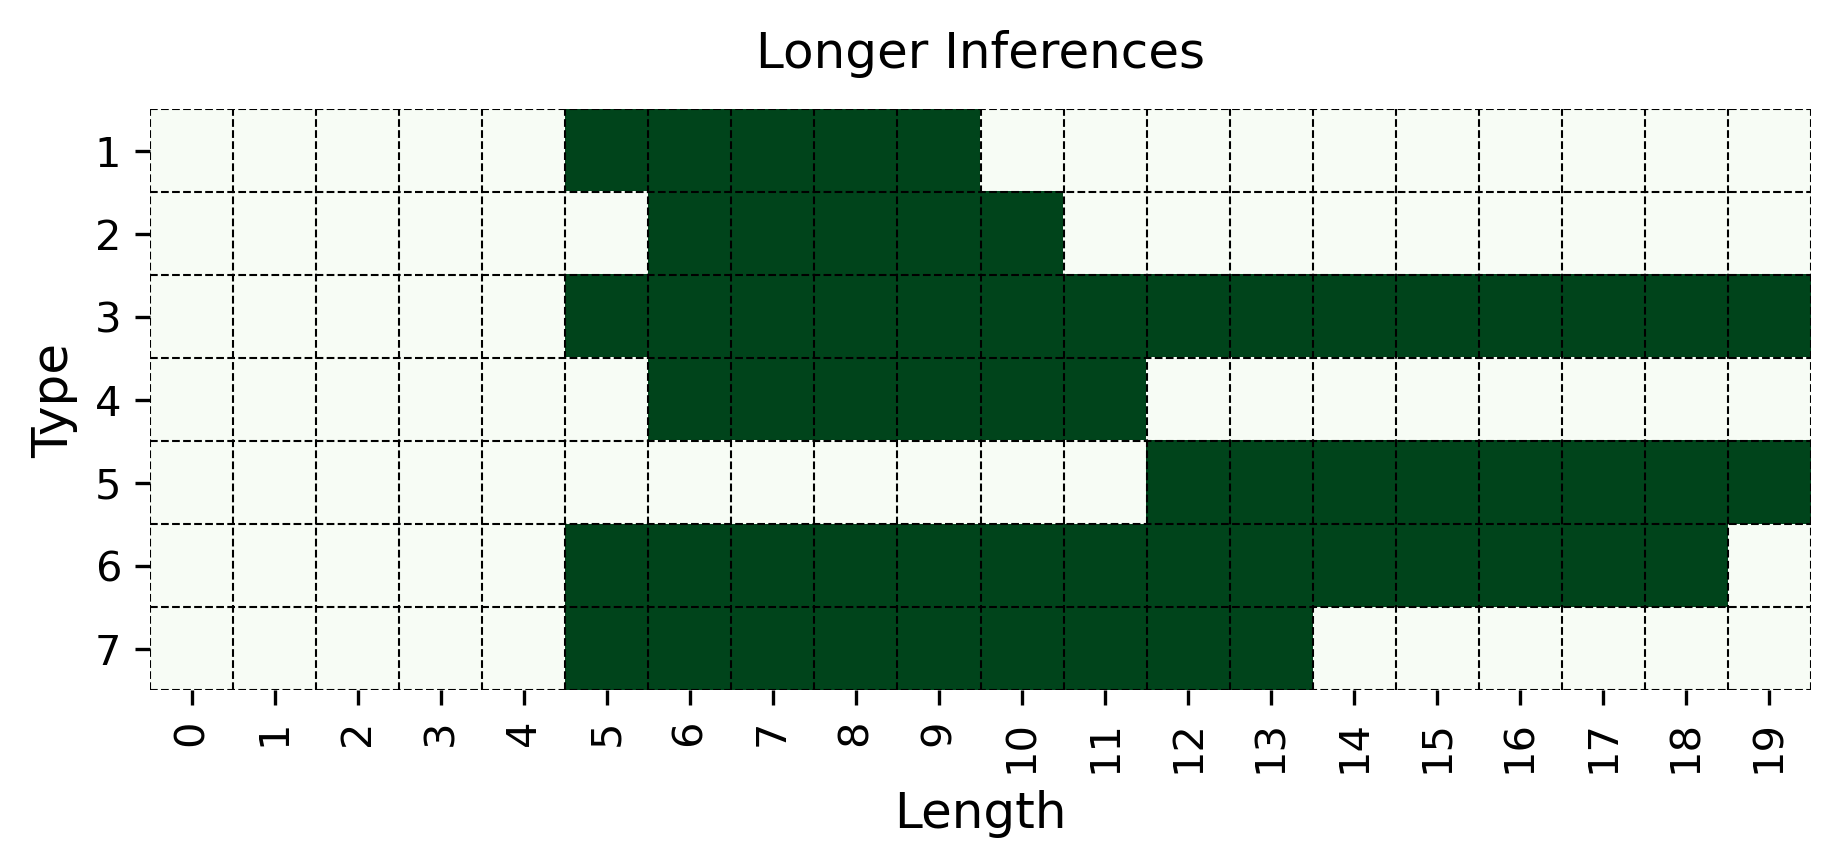
The image presents a heatmap visualizing the relationship between "Length" and "Type" for "Longer Inferences". The heatmap uses a dark green color to indicate higher values (presumably frequency or count) and white to indicate lower or zero values. The chart is structured as a grid, with "Length" on the x-axis and "Type" on the y-axis.
### Components/Axes
* **Title:** "Longer Inferences" (centered at the top)
* **X-axis Label:** "Length" (bottom-center)
* **X-axis Markers:** 0, 1, 2, 3, 4, 5, 6, 7, 8, 9, 10, 11, 12, 13, 14, 15, 16, 17, 18, 19
* **Y-axis Label:** "Type" (left-center)
* **Y-axis Markers:** 1, 2, 3, 4, 5, 6, 7
* **Color Scheme:** Dark Green (high value), White (low/zero value). No explicit legend is present, but the color scheme is implied.
### Detailed Analysis
The heatmap shows the distribution of "Length" for each "Type". I will analyze each "Type" individually, noting the lengths with high (dark green) and low (white) values.
* **Type 1:** High values from Length 4 to Length 7. Values are zero for lengths 0-3 and 8-19.
* **Type 2:** High values from Length 5 to Length 9. Values are zero for lengths 0-4 and 10-19.
* **Type 3:** High values from Length 5 to Length 19. Values are zero for lengths 0-4.
* **Type 4:** High values from Length 5 to Length 11. Values are zero for lengths 0-4 and 12-19.
* **Type 5:** High values from Length 6 to Length 11. Values are zero for lengths 0-5 and 12-19.
* **Type 6:** High values from Length 6 to Length 18. Values are zero for lengths 0-5 and 19.
* **Type 7:** High values from Length 5 to Length 7 and Length 14 to Length 15. Values are zero for lengths 0-4, 8-13 and 16-19.
### Key Observations
* Length 5 appears to have the highest frequency across most Types (1-6).
* Type 3 has the broadest distribution of lengths with high values, spanning from 5 to 19.
* Types 1, 2, 4, and 5 have relatively narrow distributions, peaking within a smaller range of lengths.
* Type 7 has a bimodal distribution, with high values at shorter lengths (5-7) and at lengths 14-15.
* There are no high values for lengths 0-4 for most types.
### Interpretation
This heatmap likely represents the distribution of inference lengths for different types of inferences. The "Type" could refer to different categories of reasoning, problem-solving, or logical steps. The data suggests that:
* Inferences generally tend to be longer than 4 steps.
* Type 3 inferences are the most diverse in length, potentially indicating a more complex or open-ended reasoning process.
* Types 1, 2, 4, and 5 inferences are more constrained in length, suggesting a more structured or defined process.
* The bimodal distribution of Type 7 suggests that these inferences may involve two distinct phases or stages, one shorter and one longer.
The absence of high values for lengths 0-4 could indicate that inferences rarely involve fewer than 5 steps, or that these shorter inferences are categorized differently. Without further context, it's difficult to determine the precise meaning of "Type" and "Length," but the heatmap provides valuable insights into the patterns of inference length across different categories.