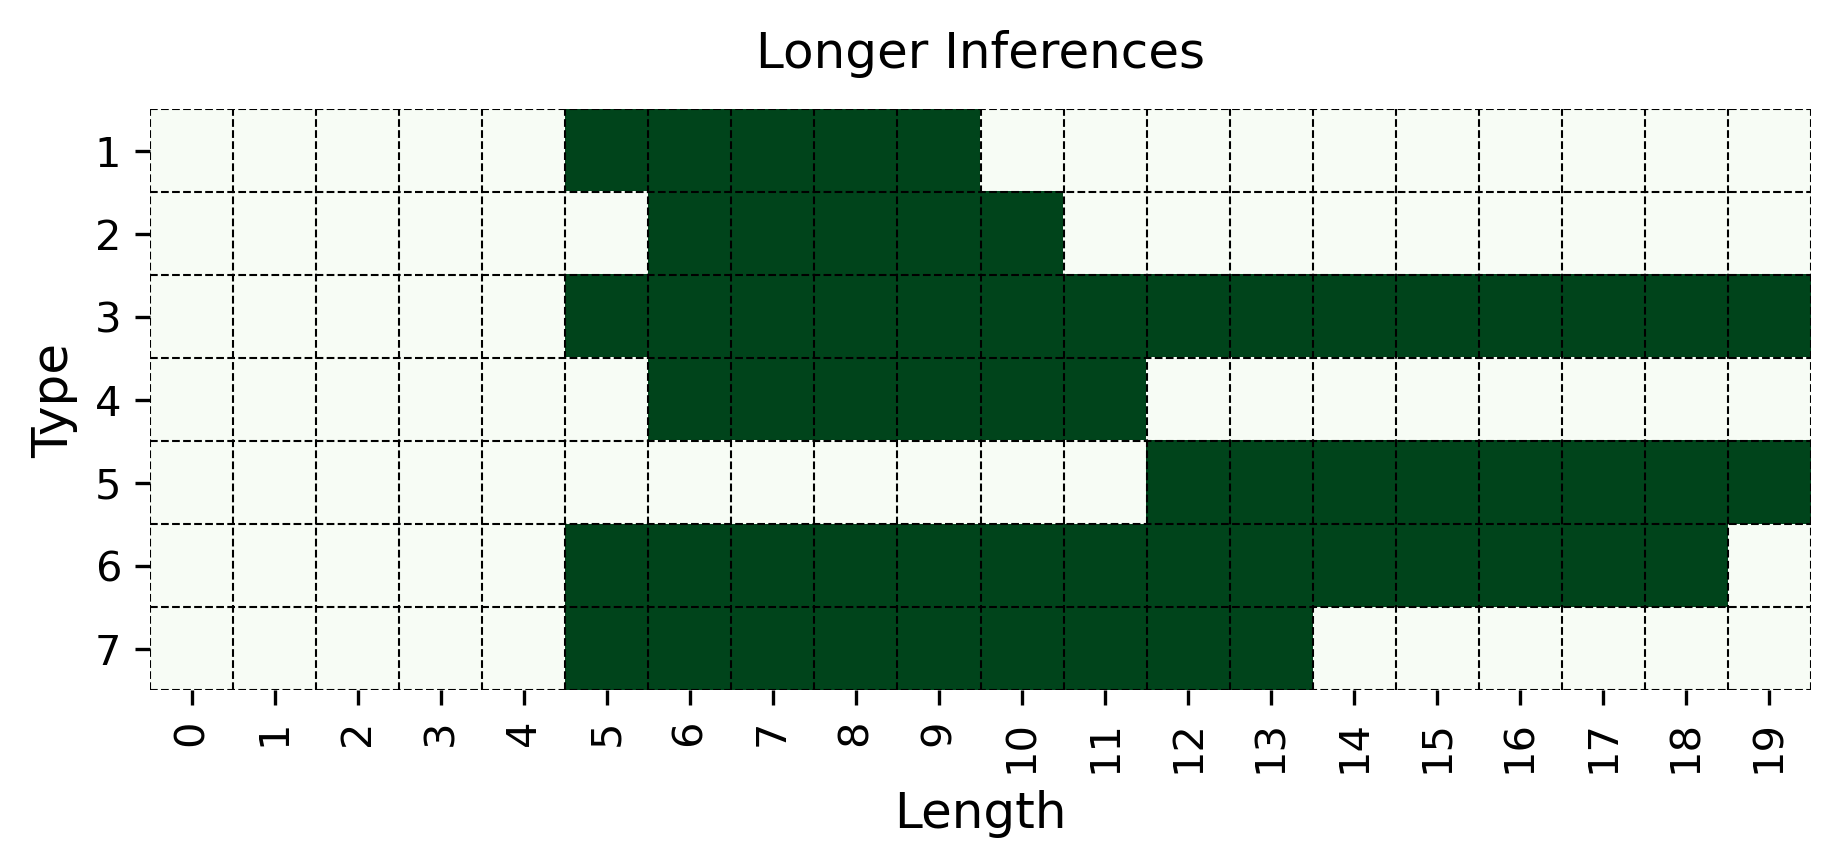
## Heatmap Chart: Longer Inferences
### Overview
The image is a heatmap-style chart titled "Longer Inferences." It visualizes the presence or absence of seven distinct categories (labeled "Type" 1 through 7) across a range of numerical values (labeled "Length" from 0 to 19). The chart uses a binary color scheme: dark green cells indicate a "present" or "true" state for a given Type-Length combination, while white cells indicate "absent" or "false."
### Components/Axes
* **Title:** "Longer Inferences" (centered at the top).
* **Vertical Axis (Y-axis):** Labeled "Type." It lists seven discrete categories, numbered 1 through 7 from top to bottom.
* **Horizontal Axis (X-axis):** Labeled "Length." It displays a continuous numerical scale from 0 to 19, with integer markers.
* **Color Legend:** Implicit. Dark green represents a positive/active state; white represents a negative/inactive state. There is no separate legend box.
* **Grid:** A fine, dashed grid overlays the entire plot area, aligning with each integer on both axes.
### Detailed Analysis
The following table reconstructs the data by listing the continuous range of "Length" values for which each "Type" has a dark green (present) cell. All ranges are inclusive.
| Type | Length Range (Present) | Approximate Span |
| :--- | :--- | :--- |
| 1 | 5 to 9 | 5 units |
| 2 | 6 to 10 | 5 units |
| 3 | 5 to 19 | 15 units |
| 4 | 6 to 11 | 6 units |
| 5 | 12 to 19 | 8 units |
| 6 | 5 to 18 | 14 units |
| 7 | 5 to 13 | 9 units |
**Spatial & Trend Verification:**
* **Type 1 (Top Row):** Green block is centered, spanning from Length 5 to 9.
* **Type 2:** Green block is shifted one unit right compared to Type 1, spanning 6 to 10.
* **Type 3:** The longest continuous green block, starting at Length 5 and extending to the chart's maximum at 19.
* **Type 4:** Green block spans from 6 to 11.
* **Type 5:** Green block starts later than others, at Length 12, and continues to 19.
* **Type 6:** A long green block from 5 to 18, ending one unit before the maximum.
* **Type 7 (Bottom Row):** Green block spans from 5 to 13.
### Key Observations
1. **Maximum Range:** Type 3 has the broadest presence, active across 15 consecutive Length units (5-19).
2. **Minimum Range:** Types 1 and 2 have the narrowest presence, each spanning only 5 units.
3. **Late Onset:** Type 5 is unique in that it only becomes active at a higher Length value (12), whereas all other types begin at Length 5 or 6.
4. **Common Starting Point:** Five of the seven types (1, 3, 5, 6, 7) have a green cell at Length 5. Type 5 is the exception, starting at 12.
5. **Pattern of Gaps:** There are no green cells for any Type at Lengths 0-4. The first activity for all types begins at Length 5 or 6.
### Interpretation
This chart likely illustrates the operational range or applicability of seven different methods, models, or categories ("Types") relative to a parameter called "Length." The title "Longer Inferences" suggests "Length" may correspond to sequence length, input size, or time steps in an inference task.
* **Type 3** appears to be the most robust or general-purpose, functioning effectively across nearly the entire spectrum of longer lengths.
* **Type 5** is a specialist, only engaged for the longest sequences (Length ≥12).
* **Types 1, 2, 4, 6, and 7** have intermediate ranges, suggesting they are optimized for specific mid-range lengths. The staggered start points (5 vs. 6) and end points indicate subtle differences in their effective domains.
* The complete absence of activity for Lengths 0-4 implies that none of these "Longer Inference" types are designed for or applied to short sequences. A different set of methods likely handles those cases.
The visualization effectively communicates that the choice of "Type" is highly dependent on the "Length" parameter, with clear segmentation of their effective ranges.