## Line Charts: Accuracy and Token Usage Across Training Progress
### Overview
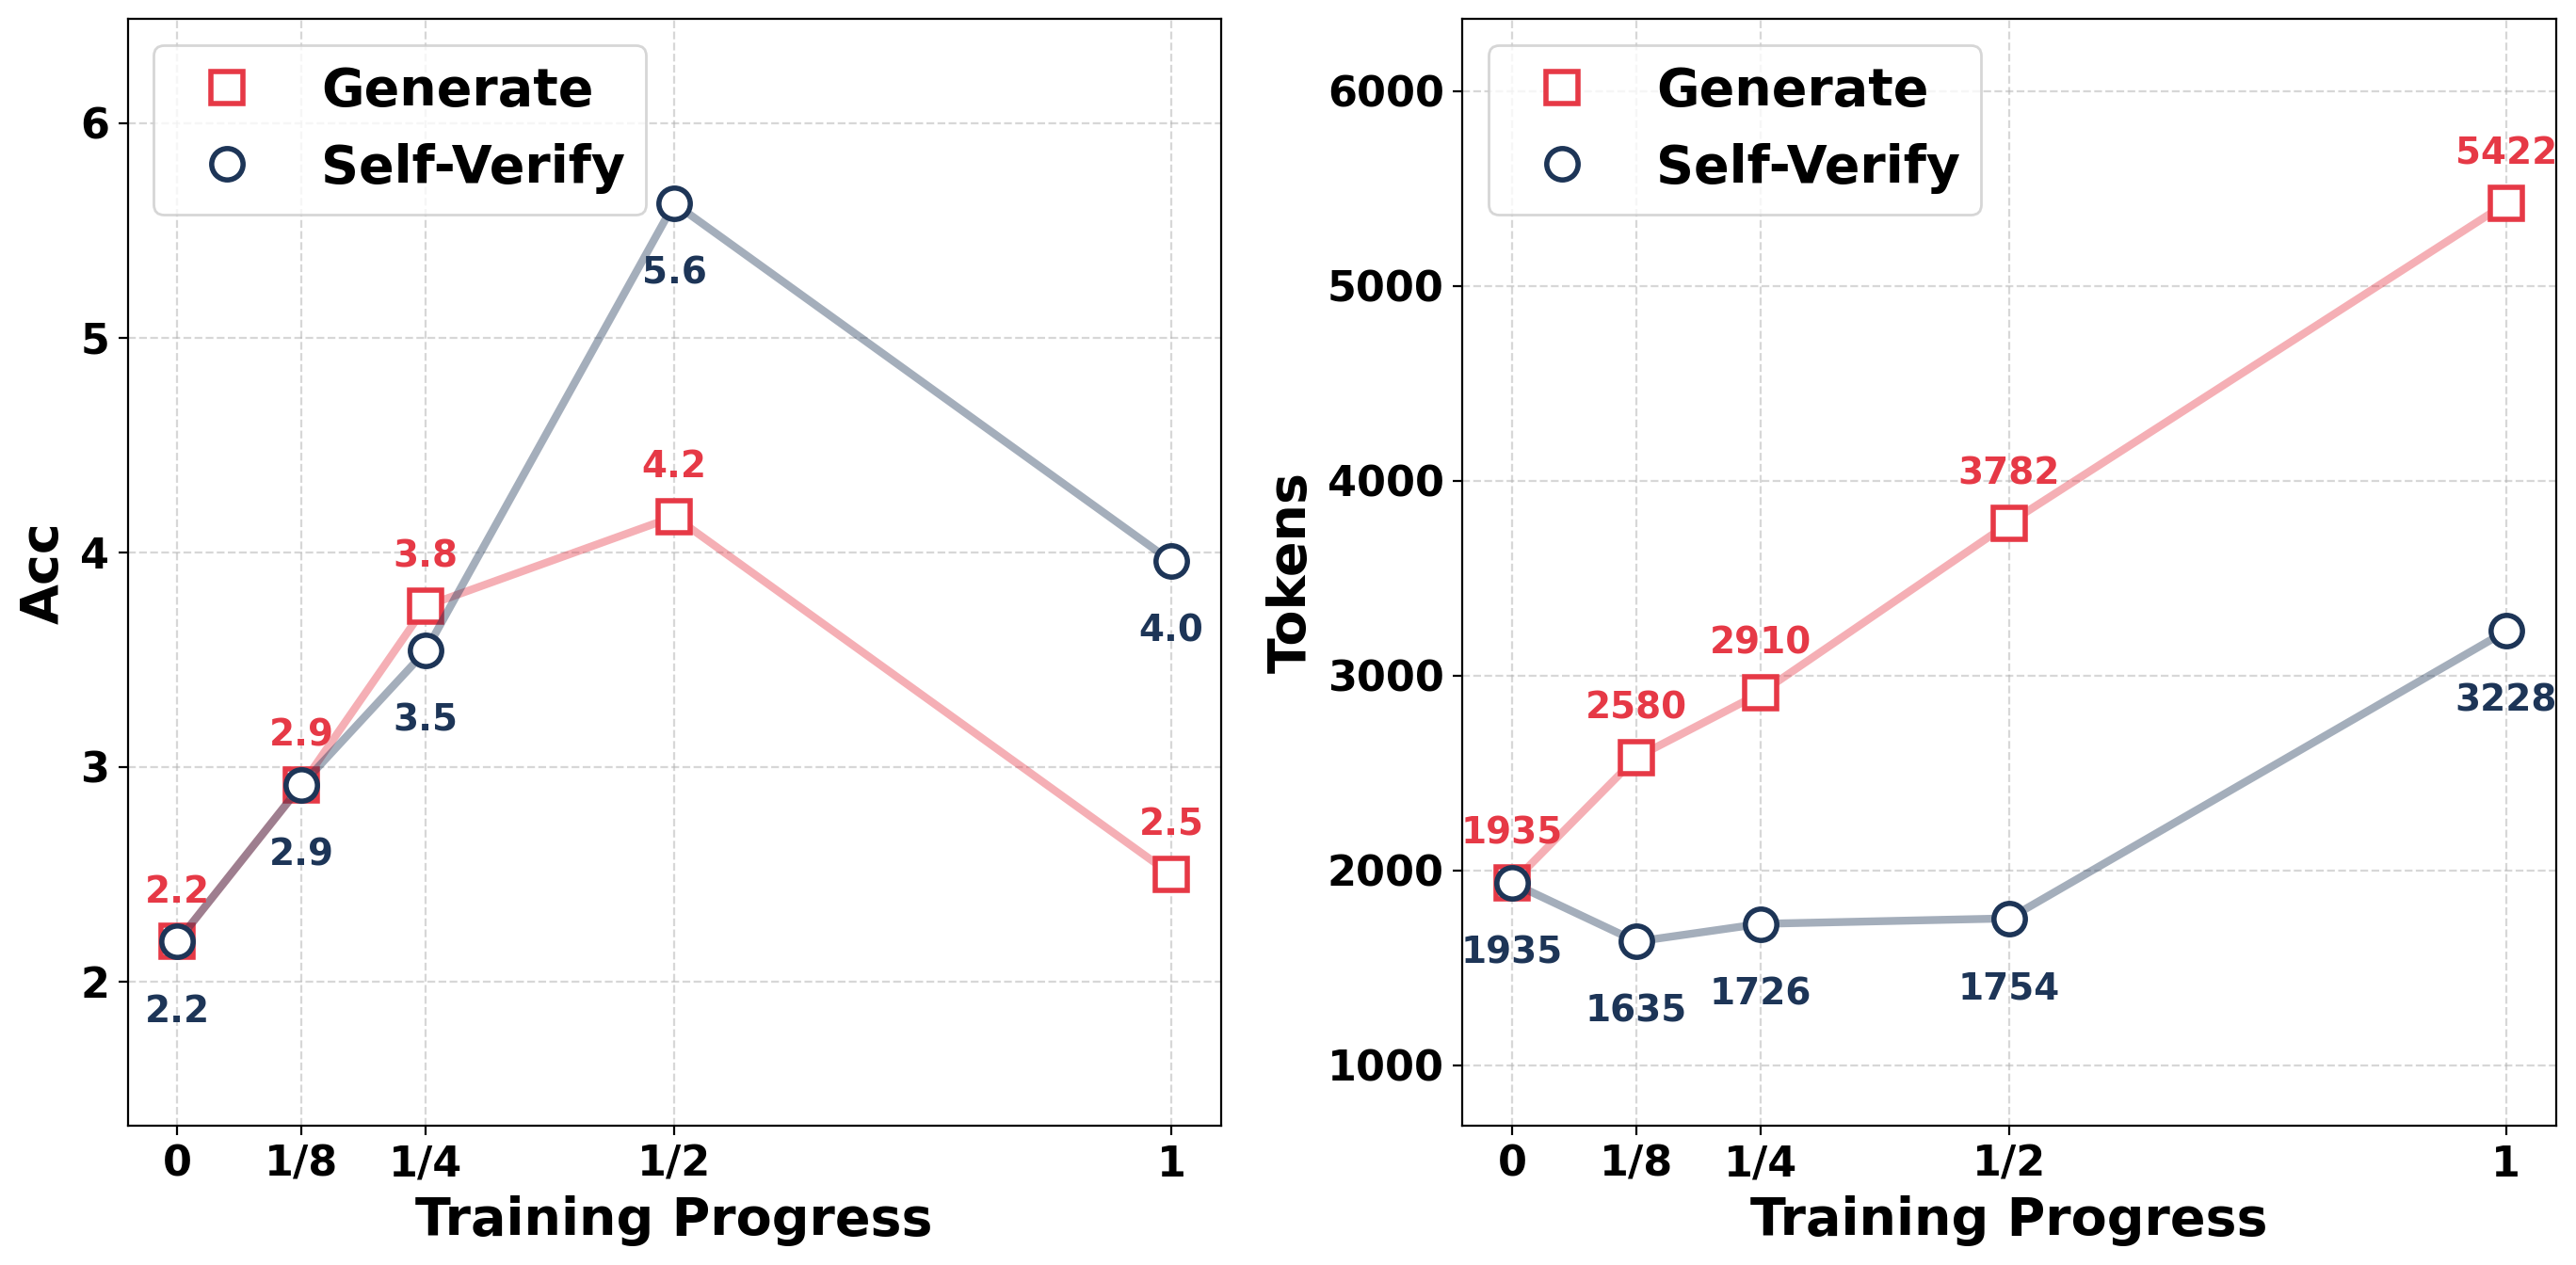
The image contains two side-by-side line charts comparing the performance of two methods ("Generate" and "Self-Verify") across training progress. The left chart tracks accuracy (Acc), while the right chart tracks token usage. Both charts use training progress (0 to 1) as the x-axis and distinct metrics as y-axes.
---
### Components/Axes
#### Left Chart (Accuracy)
- **X-axis**: Training Progress (0, 1/8, 1/4, 1/2, 1)
- **Y-axis**: Accuracy (Acc) ranging from 2 to 6
- **Legend**:
- Red squares: "Generate"
- Blue circles: "Self-Verify"
- **Legend Position**: Top-left corner
#### Right Chart (Tokens)
- **X-axis**: Training Progress (0, 1/8, 1/4, 1/2, 1)
- **Y-axis**: Tokens ranging from 1,000 to 6,000
- **Legend**: Same as left chart (red squares for "Generate," blue circles for "Self-Verify")
- **Legend Position**: Top-left corner
---
### Detailed Analysis
#### Left Chart (Accuracy)
- **Generate (Red Squares)**:
- Starts at 2.2 (0 training progress)
- Increases to 2.9 (1/8)
- Peaks at 4.2 (1/2)
- Drops to 2.5 (1)
- **Self-Verify (Blue Circles)**:
- Starts at 2.2 (0 training progress)
- Increases to 3.5 (1/4)
- Peaks at 5.6 (1/2)
- Drops to 4.0 (1)
#### Right Chart (Tokens)
- **Generate (Red Squares)**:
- Starts at 1,935 (0 training progress)
- Increases to 2,580 (1/8)
- Rises to 2,910 (1/4)
- Peaks at 3,782 (1/2)
- Ends at 5,422 (1)
- **Self-Verify (Blue Circles)**:
- Starts at 1,935 (0 training progress)
- Drops to 1,635 (1/8)
- Rises to 1,754 (1/4)
- Increases to 3,228 (1)
---
### Key Observations
1. **Accuracy Trends**:
- "Generate" accuracy peaks at 1/2 training progress (4.2) but declines sharply by 1 (2.5).
- "Self-Verify" accuracy peaks earlier (1/2 training progress, 5.6) and stabilizes at 4.0 by 1.
- "Self-Verify" consistently outperforms "Generate" after 1/4 training progress.
2. **Token Usage Trends**:
- "Generate" token usage increases monotonically, doubling from 1,935 to 5,422.
- "Self-Verify" token usage dips at 1/8 (1,635) but recovers to 3,228 by 1, showing a net increase of 65%.
- "Generate" uses significantly more tokens than "Self-Verify" at all stages.
3. **Divergence at 1/2 Training Progress**:
- "Generate" reaches its peak accuracy (4.2) and token usage (3,782) at 1/2.
- "Self-Verify" achieves higher accuracy (5.6) with fewer tokens (1,754) at this stage.
---
### Interpretation
1. **Performance Trade-offs**:
- "Self-Verify" achieves higher accuracy with lower token costs, suggesting greater efficiency. Its accuracy peaks earlier and remains stable, while "Generate" overfits or degrades later in training.
- The token usage divergence implies "Generate" may be computationally expensive, while "Self-Verify" balances accuracy and resource use.
2. **Training Dynamics**:
- The sharp drop in "Generate" accuracy after 1/2 training progress could indicate overfitting or instability in later stages.
- "Self-Verify"’s mid-training peak (1/2) suggests a more robust learning curve, possibly due to iterative verification reducing noise.
3. **Anomalies**:
- The "Self-Verify" token dip at 1/8 (1,635) is unusual but recovers quickly, hinting at a transient inefficiency or optimization phase.
---
### Conclusion
The data demonstrates that "Self-Verify" outperforms "Generate" in both accuracy and token efficiency, particularly in later training stages. This suggests that self-verification mechanisms may enhance model reliability while optimizing computational resources. Further investigation into the causes of the "Generate" accuracy drop and "Self-Verify" token dip could refine training strategies.