## Line Charts: Accuracy and Tokens vs. Training Progress
### Overview
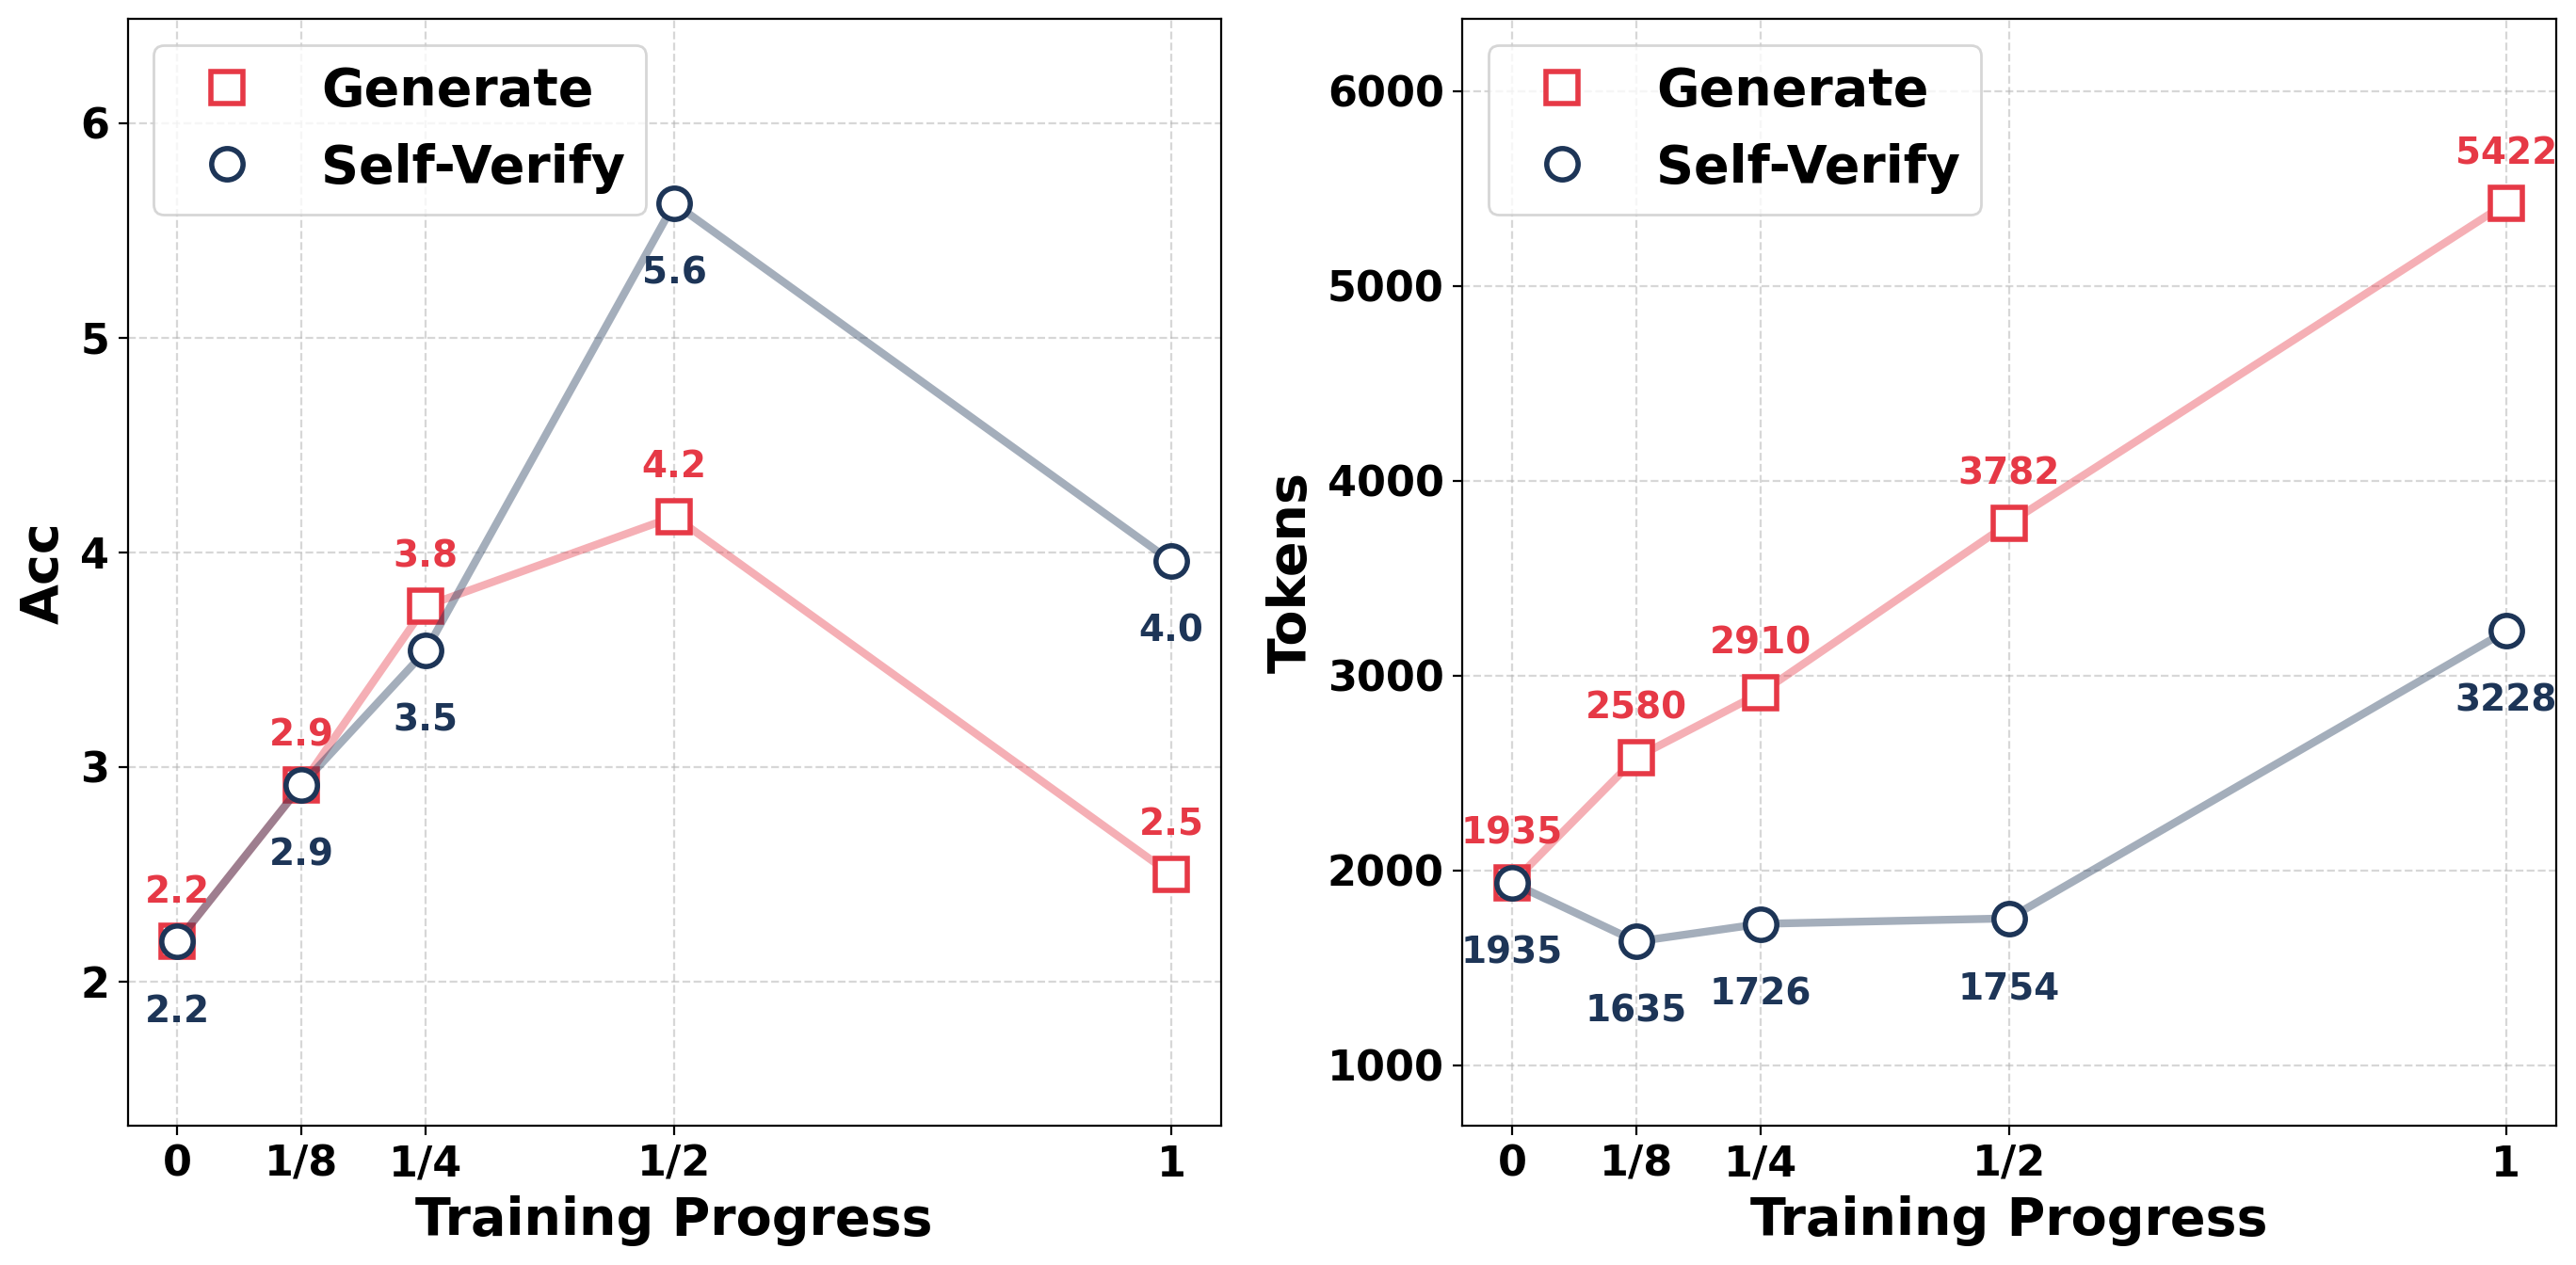
The image contains two line charts side-by-side. Both charts share the same x-axis, "Training Progress," with values 0, 1/8, 1/4, 1/2, and 1. The left chart plots "Acc" (Accuracy) on the y-axis, ranging from 2 to 6. The right chart plots "Tokens" on the y-axis, ranging from 0 to 6000. Each chart displays two data series: "Generate" (red squares) and "Self-Verify" (blue circles).
### Components/Axes
**Left Chart (Accuracy):**
* **X-axis:** Training Progress (0, 1/8, 1/4, 1/2, 1)
* **Y-axis:** Acc (Accuracy) - Scale from 2 to 6
* **Legend:** Located in the top-left corner.
* Generate (red square)
* Self-Verify (blue circle)
**Right Chart (Tokens):**
* **X-axis:** Training Progress (0, 1/8, 1/4, 1/2, 1)
* **Y-axis:** Tokens - Scale from 0 to 6000
* **Legend:** Located in the top-left corner.
* Generate (red square)
* Self-Verify (blue circle)
### Detailed Analysis
**Left Chart (Accuracy):**
* **Generate (red squares):**
* Training Progress 0: Acc = 2.2
* Training Progress 1/8: Acc = 2.9
* Training Progress 1/4: Acc = 3.8
* Training Progress 1/2: Acc = 4.2
* Training Progress 1: Acc = 2.5
* Trend: Initially increases, peaks at 1/2, then decreases.
* **Self-Verify (blue circles):**
* Training Progress 0: Acc = 2.2
* Training Progress 1/8: Acc = 2.9
* Training Progress 1/4: Acc = 3.5
* Training Progress 1/2: Acc = 5.6
* Training Progress 1: Acc = 4.0
* Trend: Increases to 1/2, then decreases.
**Right Chart (Tokens):**
* **Generate (red squares):**
* Training Progress 0: Tokens = 1935
* Training Progress 1/8: Tokens = 2580
* Training Progress 1/4: Tokens = 2910
* Training Progress 1/2: Tokens = 3782
* Training Progress 1: Tokens = 5422
* Trend: Consistently increases.
* **Self-Verify (blue circles):**
* Training Progress 0: Tokens = 1935
* Training Progress 1/8: Tokens = 1635
* Training Progress 1/4: Tokens = 1726
* Training Progress 1/2: Tokens = 1754
* Training Progress 1: Tokens = 3228
* Trend: Relatively flat until the end, then increases sharply.
### Key Observations
* In the Accuracy chart, Self-Verify outperforms Generate at Training Progress 1/2.
* In the Tokens chart, Generate consistently requires more tokens than Self-Verify.
* The Accuracy of "Generate" decreases significantly at Training Progress = 1.
* The Tokens for "Self-Verify" increase sharply at Training Progress = 1.
### Interpretation
The charts compare the performance of "Generate" and "Self-Verify" methods across different stages of training. The Accuracy chart suggests that "Self-Verify" is more effective at a certain point in training (1/2), but both methods see a decrease in accuracy at the end of training. The Tokens chart indicates that "Generate" consistently requires more tokens, suggesting it might be less efficient. The sharp increase in tokens for "Self-Verify" at the end of training could indicate a change in behavior or complexity of the model. The data suggests that the optimal training progress may be around 1/2, where "Self-Verify" achieves higher accuracy with fewer tokens compared to "Generate". Further investigation is needed to understand the drop in accuracy at Training Progress = 1 and the late increase in tokens for "Self-Verify".