\n
## Charts: Accuracy (Acc) vs. Training Progress & Tokens vs. Training Progress
### Overview
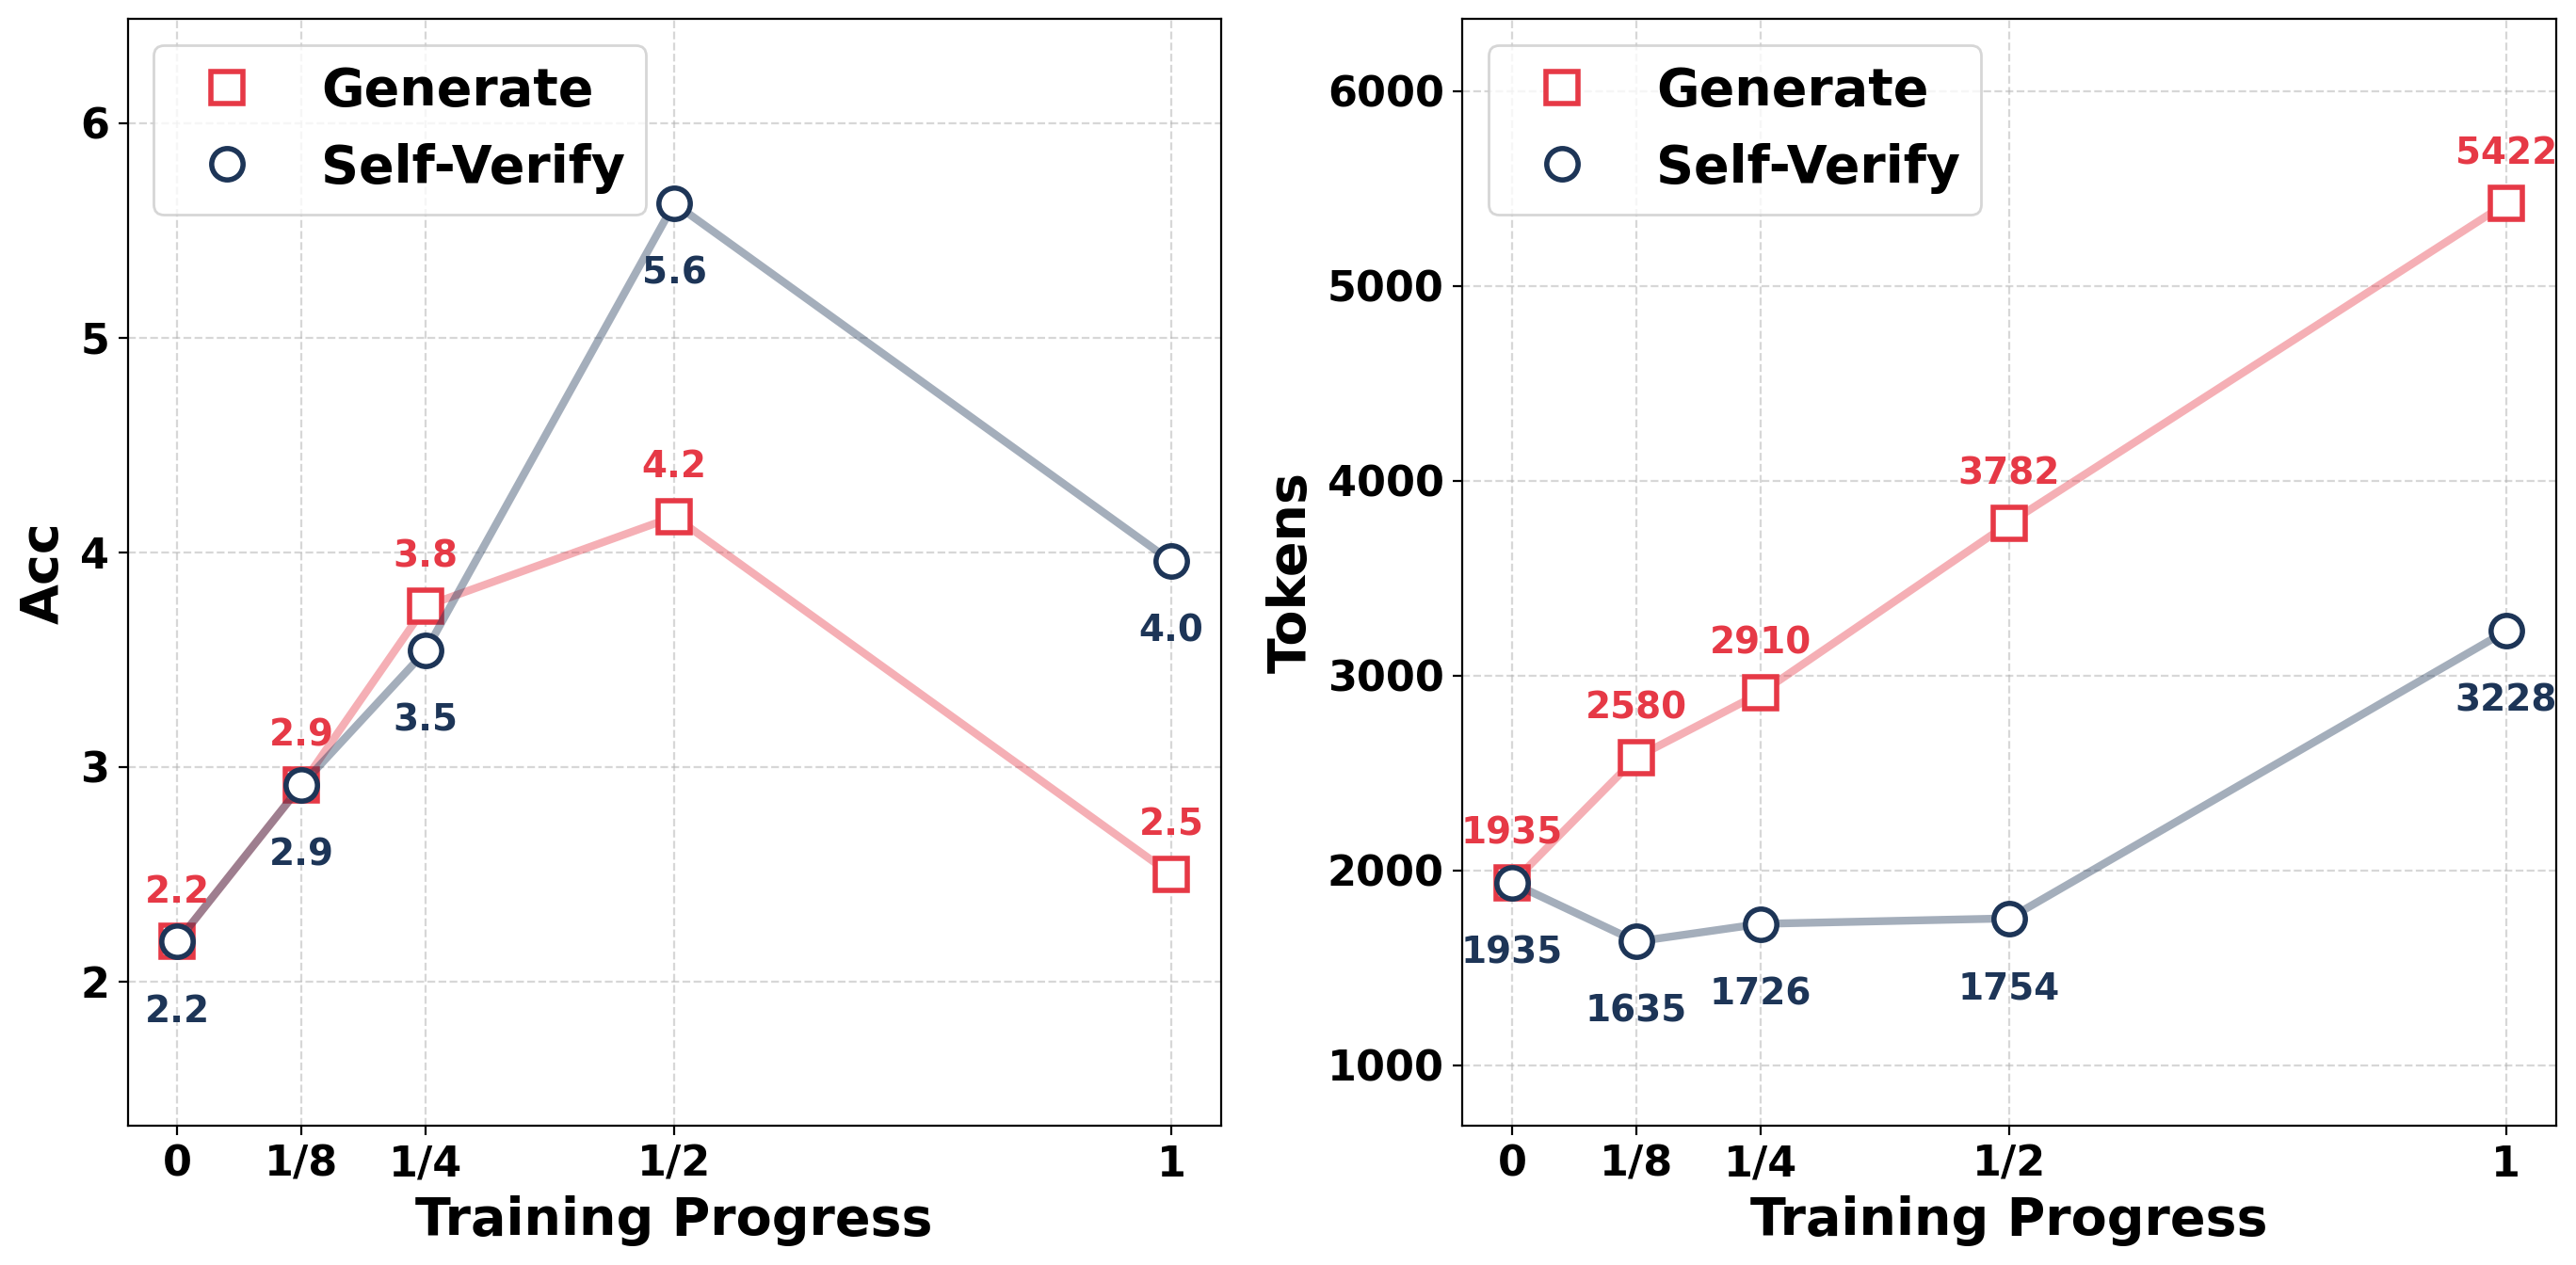
The image presents two line charts displayed side-by-side. The left chart shows the relationship between Accuracy (Acc) and Training Progress for two methods: "Generate" and "Self-Verify". The right chart shows the relationship between Tokens and Training Progress, also for "Generate" and "Self-Verify". Both charts share the same x-axis representing Training Progress, scaled from 0 to 1, with intermediate markers at 0, 1/8, 1/4, 1/2, and 1.
### Components/Axes
**Left Chart:**
* **X-axis:** Training Progress (0 to 1, with markers at 0, 1/8, 1/4, 1/2, 1)
* **Y-axis:** Acc (approximately 2 to 6)
* **Legend:**
* Generate (Red Square)
* Self-Verify (Blue Circle)
**Right Chart:**
* **X-axis:** Training Progress (0 to 1, with markers at 0, 1/8, 1/4, 1/2, 1)
* **Y-axis:** Tokens (approximately 1000 to 6000)
* **Legend:**
* Generate (Red Square)
* Self-Verify (Blue Circle)
### Detailed Analysis or Content Details
**Left Chart (Acc vs. Training Progress):**
* **Generate (Red Square):** The line representing "Generate" initially slopes upward, then downward.
* At Training Progress 0: Acc ≈ 2.2
* At Training Progress 1/8: Acc ≈ 2.9
* At Training Progress 1/4: Acc ≈ 3.5
* At Training Progress 1/2: Acc ≈ 4.2
* At Training Progress 1: Acc ≈ 2.5
* **Self-Verify (Blue Circle):** The line representing "Self-Verify" initially slopes upward, reaching a peak, then slopes downward.
* At Training Progress 0: Acc ≈ 2.9
* At Training Progress 1/8: Acc ≈ 3.8
* At Training Progress 1/4: Acc ≈ 4.0
* At Training Progress 1/2: Acc ≈ 5.6
* At Training Progress 1: Acc ≈ 4.0
**Right Chart (Tokens vs. Training Progress):**
* **Generate (Red Square):** The line representing "Generate" slopes consistently upward.
* At Training Progress 0: Tokens ≈ 1935
* At Training Progress 1/8: Tokens ≈ 2580
* At Training Progress 1/4: Tokens ≈ 2910
* At Training Progress 1/2: Tokens ≈ 3782
* At Training Progress 1: Tokens ≈ 5422
* **Self-Verify (Blue Circle):** The line representing "Self-Verify" slopes upward, but less steeply than "Generate".
* At Training Progress 0: Tokens ≈ 1635
* At Training Progress 1/8: Tokens ≈ 1726
* At Training Progress 1/4: Tokens ≈ 1754
* At Training Progress 1/2: Tokens ≈ 2000 (approximately)
* At Training Progress 1: Tokens ≈ 3228
### Key Observations
* The "Generate" method shows a more pronounced increase in Accuracy up to the 1/2 Training Progress mark, but then experiences a significant drop-off.
* The "Self-Verify" method exhibits a more stable Accuracy curve, peaking at 1/2 Training Progress and then declining less dramatically than "Generate".
* The "Generate" method consistently requires more Tokens than the "Self-Verify" method throughout the training process.
* Both methods show an increasing trend in Token usage as Training Progress increases.
### Interpretation
The data suggests that the "Generate" method initially learns faster (higher accuracy gain per unit of training progress) but may be prone to overfitting or instability, as evidenced by the sharp decline in accuracy at the end of the training process. The "Self-Verify" method, while slower to gain initial accuracy, demonstrates more robustness and stability. The difference in Token usage indicates that the "Generate" method is more computationally expensive, potentially due to its more complex learning process.
The relationship between Accuracy and Tokens is interesting. While "Generate" achieves higher accuracy initially, it does so at a higher cost in terms of Tokens. This raises questions about the efficiency of the "Generate" method and whether the initial accuracy gains justify the increased computational expense. The charts provide a valuable comparison of the two methods, highlighting their respective strengths and weaknesses. The peak in accuracy for "Self-Verify" at 1/2 training progress suggests an optimal point for stopping training to maximize performance.