\n
## Diagram: Logical Inference Flow
### Overview
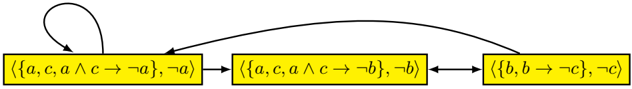
The image depicts a diagram illustrating a logical inference process. It consists of three yellow rectangular blocks connected by arrows, representing states or propositions in a logical sequence. Each block contains a set of logical statements. A curved arrow indicates a feedback loop from the first block to itself.
### Components/Axes
The diagram consists of:
* **Three Blocks:** Each block contains a set of logical statements enclosed in curly braces.
* **Arrows:** Arrows indicate the direction of inference or transformation between the blocks.
* **Curved Arrow:** A curved arrow indicates a recursive or feedback relationship.
### Detailed Analysis or Content Details
The content of each block is as follows:
* **Block 1 (Left):** `{a, c, a ∧ c → ¬a, ¬a}`
* **Block 2 (Center):** `{a, c, a ∧ c → ¬b, ¬b}`
* **Block 3 (Right):** `{b, b → ¬c, ¬c}`
The arrows indicate a flow from Block 1 to Block 2, and from Block 2 to Block 3. The curved arrow originates from Block 1 and returns to Block 1.
### Key Observations
The diagram presents a sequence of logical statements and their transformations. The statements within each block appear to be related through logical implication (represented by the "→" symbol). The presence of negations (¬) suggests a process of contradiction or deduction. The feedback loop indicates a potential iterative process.
### Interpretation
This diagram likely represents a step-by-step logical deduction or proof. Each block represents a state of knowledge, and the arrows represent the application of logical rules to derive new knowledge. The feedback loop suggests that the process may involve revisiting earlier assumptions or statements based on new information.
The statements within the blocks appear to be related to propositional logic, where variables (a, b, c) represent propositions, and logical operators (∧ for "and", → for "implies", ¬ for "not") are used to combine them. The diagram could be illustrating a method for deriving contradictions or proving the validity of certain logical arguments.
The diagram does not provide any numerical data or quantitative information. It is a purely conceptual representation of a logical process. The specific meaning of the statements would depend on the context in which the diagram is used. It is a visual representation of a logical argument or a sequence of inferences.