\n
## Diagram: Process Flow or System Architecture
### Overview
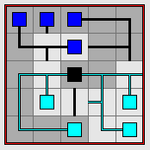
The image depicts a diagram representing a process flow or system architecture. It consists of interconnected rectangular blocks, some colored blue, some cyan, and one black, connected by lines indicating the flow of information or materials. The background is a grid pattern. There are no explicit labels or axis titles.
### Components/Axes
The diagram contains the following components:
* **Blue Blocks (x4):** Located in the top portion of the diagram.
* **Cyan Blocks (x4):** Located in the bottom portion of the diagram.
* **Black Block (x1):** Centrally located, connecting the upper and lower sections.
* **Black Lines:** Connecting the blue blocks and the black block.
* **Cyan Lines:** Connecting the cyan blocks and the black block.
* **Grid Background:** A uniform grid pattern covering the entire diagram.
### Detailed Analysis or Content Details
The diagram can be divided into two main sections: an upper section with blue blocks and a lower section with cyan blocks. The black block acts as a central connector between these two sections.
* **Upper Section:** Three blue blocks are arranged horizontally at the top. These are connected by a black line that forms a "U" shape, connecting the leftmost and rightmost blocks through a central block.
* **Lower Section:** Four cyan blocks are arranged in a rectangular pattern. These are connected by a cyan line that forms a closed loop, with a vertical line extending upwards to connect to the black block.
* **Central Connection:** The black block is positioned centrally and is connected to the upper section via a black line descending from the central blue block. It is also connected to the lower section via a vertical cyan line.
There are no numerical values or specific data points present in the diagram. The diagram is purely representational.
### Key Observations
The diagram suggests a process where information or materials flow from the blue blocks, through the black block, and then to the cyan blocks. The closed loop in the lower section suggests a feedback mechanism or a cyclical process. The black block appears to be a critical component, acting as a central processing unit or a control point.
### Interpretation
The diagram likely represents a simplified model of a system or process. The blue blocks could represent input sources, the cyan blocks could represent output destinations, and the black block could represent a processing unit. The lines indicate the flow of information or materials between these components.
The closed loop in the lower section suggests a feedback mechanism, where the output of the cyan blocks influences the input to the black block, potentially adjusting the process. The diagram's simplicity suggests it is intended to convey a high-level overview of the system, rather than a detailed technical specification.
Without additional context, it is difficult to determine the specific nature of the process or system being represented. However, the diagram provides a clear visual representation of the relationships between the different components and the flow of information or materials. The diagram is a visual metaphor, and its meaning is dependent on the context in which it is used. It could represent anything from a manufacturing process to a software architecture.