## Box Plot Comparison: MSE and Hybrid Loss for BAST-NSP and BAST-SP
### Overview
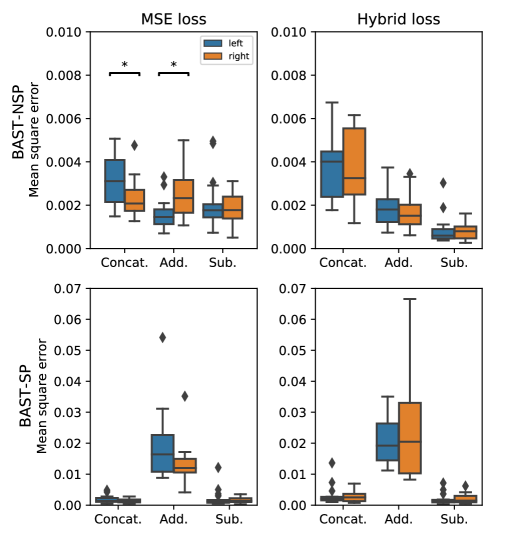
The image presents four box plots comparing the Mean Square Error (MSE) loss and Hybrid loss for two models, BAST-NSP and BAST-SP, across three different operations: Concatenation (Concat.), Addition (Add.), and Subtraction (Sub.). The box plots show the distribution of the error for "left" and "right" data.
### Components/Axes
* **Titles:**
* Top-Left: "MSE loss"
* Top-Right: "Hybrid loss"
* Left-Side (Top and Bottom): "BAST-NSP" and "BAST-SP" respectively.
* **Y-Axis (Vertical):** "Mean square error"
* Top Plots (BAST-NSP): Scale from 0.000 to 0.010, incrementing by 0.002.
* Bottom Plots (BAST-SP): Scale from 0.00 to 0.07, incrementing by 0.01.
* **X-Axis (Horizontal):** "Concat.", "Add.", "Sub." representing different operations.
* **Legend:** Located at the top-center of the image.
* Blue: "left"
* Orange: "right"
* **Statistical Significance:** Asterisks (*) indicate statistically significant differences between groups.
### Detailed Analysis
**1. MSE Loss (BAST-NSP - Top-Left)**
* **Concat.:** The "left" data (blue) has a median around 0.0025, with the box extending from approximately 0.0015 to 0.004. The "right" data (orange) has a median around 0.002, with the box extending from approximately 0.001 to 0.003.
* **Add.:** The "left" data (blue) has a median around 0.0015, with the box extending from approximately 0.001 to 0.003. The "right" data (orange) has a median around 0.002, with the box extending from approximately 0.001 to 0.004. There is an outlier at approximately 0.005.
* **Sub.:** The "left" data (blue) has a median around 0.0015, with the box extending from approximately 0.001 to 0.0025. The "right" data (orange) has a median around 0.002, with the box extending from approximately 0.001 to 0.003. There is an outlier at approximately 0.005.
* **Statistical Significance:** There is a statistically significant difference between "left" and "right" for both "Concat." and "Add." operations.
**2. Hybrid Loss (BAST-NSP - Top-Right)**
* **Concat.:** The "left" data (blue) has a median around 0.003, with the box extending from approximately 0.002 to 0.004. The "right" data (orange) has a median around 0.0045, with the box extending from approximately 0.003 to 0.006.
* **Add.:** The "left" data (blue) has a median around 0.0015, with the box extending from approximately 0.001 to 0.0025. The "right" data (orange) has a median around 0.0015, with the box extending from approximately 0.001 to 0.003. There are outliers for the "right" data at approximately 0.002 and 0.003.
* **Sub.:** Both "left" (blue) and "right" (orange) data have medians around 0.001, with boxes extending from approximately 0.0005 to 0.0015. There are outliers for the "right" data at approximately 0.002 and 0.003.
**3. MSE Loss (BAST-SP - Bottom-Left)**
* **Concat.:** Both "left" (blue) and "right" (orange) data have medians close to 0.00, with boxes extending from approximately 0.00 to 0.001.
* **Add.:** The "left" data (blue) has a median around 0.015, with the box extending from approximately 0.01 to 0.025. The "right" data (orange) has a median around 0.015, with the box extending from approximately 0.01 to 0.02. There is an outlier for the "left" data at approximately 0.055.
* **Sub.:** Both "left" (blue) and "right" (orange) data have medians close to 0.00, with boxes extending from approximately 0.00 to 0.001.
**4. Hybrid Loss (BAST-SP - Bottom-Right)**
* **Concat.:** Both "left" (blue) and "right" (orange) data have medians close to 0.00, with boxes extending from approximately 0.00 to 0.001. There is an outlier for the "left" data at approximately 0.015.
* **Add.:** The "left" data (blue) has a median around 0.02, with the box extending from approximately 0.01 to 0.03. The "right" data (orange) has a median around 0.03, with the box extending from approximately 0.02 to 0.04. The "right" data has a long tail extending to approximately 0.07.
* **Sub.:** Both "left" (blue) and "right" (orange) data have medians close to 0.00, with boxes extending from approximately 0.00 to 0.002.
### Key Observations
* For BAST-NSP, the MSE loss shows statistically significant differences between "left" and "right" data for "Concat." and "Add." operations.
* For BAST-SP, the MSE loss is significantly higher for the "Add." operation compared to "Concat." and "Sub."
* For BAST-SP, the Hybrid loss is also higher for the "Add." operation compared to "Concat." and "Sub.", with a long tail for the "right" data.
* BAST-SP generally has higher error values than BAST-NSP, especially for the "Add." operation.
### Interpretation
The box plots provide a comparative analysis of the performance of BAST-NSP and BAST-SP models under different loss functions (MSE and Hybrid) and operations (Concat., Add., Sub.). The data suggests that:
* The choice of operation significantly impacts the error, particularly for BAST-SP, where "Add." results in much higher error values.
* The Hybrid loss function seems to mitigate the error for BAST-SP in the "Add." operation compared to the MSE loss.
* The statistical significance observed in BAST-NSP's MSE loss for "Concat." and "Add." indicates a consistent difference in performance between "left" and "right" data for these operations.
* BAST-NSP generally performs better than BAST-SP, as indicated by the lower error values across most operations and loss functions.