\n
## Line Chart: Answer Accuracy vs. Layer for Mistral Models
### Overview
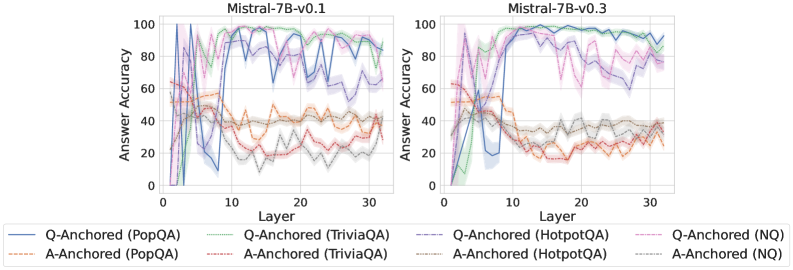
This image presents two line charts, side-by-side, comparing the answer accuracy of the Mistral-7B-v0.1 and Mistral-7B-v0.3 models across different layers. The charts display accuracy as a function of layer number, with separate lines representing different question-answering datasets and anchoring methods. Each chart has a similar structure, with the x-axis representing the layer number and the y-axis representing answer accuracy.
### Components/Axes
* **X-axis:** Layer (ranging from approximately 0 to 32).
* **Y-axis:** Answer Accuracy (ranging from 0 to 100).
* **Left Chart Title:** Mistral-7B-v0.1
* **Right Chart Title:** Mistral-7B-v0.3
* **Legend (Bottom):**
* Blue Line: Q-Anchored (PopQA)
* Orange Line: A-Anchored (PopQA)
* Green Line: Q-Anchored (TriviaQA)
* Purple Line: A-Anchored (TriviaQA)
* Gray Dashed Line: Q-Anchored (HotpotQA)
* Gray Line: A-Anchored (HotpotQA)
* Light Blue Line: Q-Anchored (NQ)
* Light Orange Line: A-Anchored (NQ)
### Detailed Analysis or Content Details
**Mistral-7B-v0.1 (Left Chart):**
* **Q-Anchored (PopQA) - Blue Line:** Starts at approximately 0% accuracy, rapidly increases to around 90-95% by layer 5, then fluctuates between 80-95% for the remainder of the layers.
* **A-Anchored (PopQA) - Orange Line:** Starts at approximately 0% accuracy, increases to around 50% by layer 5, then fluctuates between 20-50% for the remainder of the layers.
* **Q-Anchored (TriviaQA) - Green Line:** Starts at approximately 0% accuracy, rapidly increases to around 90-95% by layer 5, then fluctuates between 80-95% for the remainder of the layers.
* **A-Anchored (TriviaQA) - Purple Line:** Starts at approximately 0% accuracy, increases to around 60% by layer 5, then fluctuates between 30-60% for the remainder of the layers.
* **Q-Anchored (HotpotQA) - Gray Dashed Line:** Starts at approximately 0% accuracy, increases to around 60% by layer 5, then fluctuates between 30-60% for the remainder of the layers.
* **A-Anchored (HotpotQA) - Gray Line:** Starts at approximately 0% accuracy, increases to around 40% by layer 5, then fluctuates between 20-40% for the remainder of the layers.
* **Q-Anchored (NQ) - Light Blue Line:** Starts at approximately 0% accuracy, increases to around 80% by layer 5, then fluctuates between 60-80% for the remainder of the layers.
* **A-Anchored (NQ) - Light Orange Line:** Starts at approximately 0% accuracy, increases to around 40% by layer 5, then fluctuates between 20-40% for the remainder of the layers.
**Mistral-7B-v0.3 (Right Chart):**
* **Q-Anchored (PopQA) - Blue Line:** Starts at approximately 0% accuracy, rapidly increases to around 95-100% by layer 5, then remains consistently high (85-100%) for the remainder of the layers.
* **A-Anchored (PopQA) - Orange Line:** Starts at approximately 0% accuracy, increases to around 50% by layer 5, then fluctuates between 30-50% for the remainder of the layers.
* **Q-Anchored (TriviaQA) - Green Line:** Starts at approximately 0% accuracy, rapidly increases to around 95-100% by layer 5, then remains consistently high (85-100%) for the remainder of the layers.
* **A-Anchored (TriviaQA) - Purple Line:** Starts at approximately 0% accuracy, increases to around 60% by layer 5, then fluctuates between 40-60% for the remainder of the layers.
* **Q-Anchored (HotpotQA) - Gray Dashed Line:** Starts at approximately 0% accuracy, increases to around 60% by layer 5, then fluctuates between 40-60% for the remainder of the layers.
* **A-Anchored (HotpotQA) - Gray Line:** Starts at approximately 0% accuracy, increases to around 40% by layer 5, then fluctuates between 20-40% for the remainder of the layers.
* **Q-Anchored (NQ) - Light Blue Line:** Starts at approximately 0% accuracy, increases to around 85% by layer 5, then fluctuates between 65-85% for the remainder of the layers.
* **A-Anchored (NQ) - Light Orange Line:** Starts at approximately 0% accuracy, increases to around 40% by layer 5, then fluctuates between 20-40% for the remainder of the layers.
### Key Observations
* Both models show a significant increase in accuracy within the first 5 layers.
* Q-Anchored methods consistently outperform A-Anchored methods across all datasets for both models.
* Mistral-7B-v0.3 generally achieves higher and more stable accuracy than Mistral-7B-v0.1, particularly for the PopQA and TriviaQA datasets.
* The HotpotQA and NQ datasets exhibit lower overall accuracy compared to PopQA and TriviaQA.
* The accuracy curves tend to stabilize after layer 10, with fluctuations around a certain level.
### Interpretation
The charts demonstrate the impact of model version (v0.1 vs. v0.3) and anchoring method (Q-Anchored vs. A-Anchored) on answer accuracy across different question-answering datasets. The rapid increase in accuracy within the initial layers suggests that the early layers of the model are crucial for learning basic question-answering capabilities. The consistently higher performance of Q-Anchored methods indicates that anchoring questions is more effective than anchoring answers for this task.
The improved performance of Mistral-7B-v0.3 suggests that the updates made between versions have resulted in a more robust and accurate model. The differences in accuracy across datasets highlight the challenges of generalizing question-answering models to diverse types of questions. The stabilization of accuracy after layer 10 suggests that further increasing the model depth may not yield significant improvements in performance.
The data suggests that the model's ability to understand and process questions is more important than its ability to process answers, as evidenced by the superior performance of Q-Anchored methods. The differences between the two models indicate that improvements in model architecture or training data can lead to substantial gains in answer accuracy.