TECHNICAL ASSET FINGERPRINT
3a3ee81156ac07be44a6adec
Click to view fullscreen
Press ESC or click to close
FOUND IN PAPERS
EXPERT: healer-alpha-free VERSION 1
RUNTIME: free/openrouter/healer-alpha
INTEL_VERIFIED
## Line Charts: Mistral-7B Model Layer-wise Answer Accuracy
### Overview
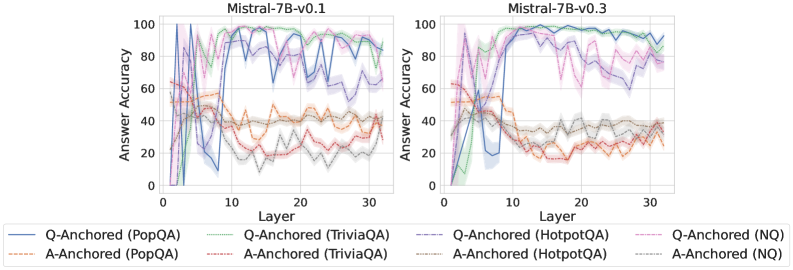
The image displays two side-by-side line charts comparing the "Answer Accuracy" across model layers (0-30) for two versions of the Mistral-7B model: v0.1 (left) and v0.3 (right). Each chart plots the performance of eight different evaluation setups, distinguished by anchoring method (Q-Anchored or A-Anchored) and dataset (PopQA, TriviaQA, HotpotQA, NQ). The lines include shaded regions, likely representing confidence intervals or standard deviation.
### Components/Axes
* **Chart Titles:** "Mistral-7B-v0.1" (left chart), "Mistral-7B-v0.3" (right chart). Positioned at the top-center of each respective plot.
* **Y-Axis:** Label is "Answer Accuracy". Scale runs from 0 to 100 with major tick marks at 0, 20, 40, 60, 80, 100.
* **X-Axis:** Label is "Layer". Scale runs from 0 to 30 with major tick marks at 0, 10, 20, 30.
* **Legend:** Positioned below both charts, centered. It contains eight entries, each with a colored line sample and a text label:
1. `Q-Anchored (PopQA)` - Solid blue line
2. `A-Anchored (PopQA)` - Dashed orange line
3. `Q-Anchored (TriviaQA)` - Solid green line
4. `A-Anchored (TriviaQA)` - Dashed red line
5. `Q-Anchored (HotpotQA)` - Dashed purple line
6. `A-Anchored (HotpotQA)` - Dashed brown line
7. `Q-Anchored (NQ)` - Dashed pink line
8. `A-Anchored (NQ)` - Dashed gray line
### Detailed Analysis
**Mistral-7B-v0.1 (Left Chart):**
* **Q-Anchored (PopQA) [Solid Blue]:** Starts near 0, rises sharply to a peak of ~95-100 around layer 8, then fluctuates with a general downward trend, ending near 80 at layer 30.
* **Q-Anchored (TriviaQA) [Solid Green]:** Starts near 0, rises very steeply to near 100 by layer 5, maintains high accuracy (~90-100) with some volatility across all layers.
* **Q-Anchored (HotpotQA) [Dashed Purple]:** Starts near 0, rises to a peak of ~90 around layer 10, then shows a gradual decline with significant fluctuations, ending near 60 at layer 30.
* **Q-Anchored (NQ) [Dashed Pink]:** Starts near 0, rises to a peak of ~85 around layer 7, then declines steadily with fluctuations, ending near 40 at layer 30.
* **A-Anchored Lines (All Dashed):** All four A-Anchored series (PopQA-orange, TriviaQA-red, HotpotQA-brown, NQ-gray) show significantly lower performance than their Q-Anchored counterparts. They generally start between 20-60, exhibit a slight downward trend or remain relatively flat with high variance, and cluster between 20-40 accuracy by layer 30. The A-Anchored (PopQA) [orange] line is often the highest among this group.
**Mistral-7B-v0.3 (Right Chart):**
* **Q-Anchored (PopQA) [Solid Blue]:** Starts near 0, rises to a peak of ~95 around layer 10, then maintains a very high and stable accuracy (~90-95) through layer 30, showing less decline than in v0.1.
* **Q-Anchored (TriviaQA) [Solid Green]:** Similar to v0.1, starts near 0, rockets to near 100 by layer 5, and remains extremely high and stable (~95-100) across all subsequent layers.
* **Q-Anchored (HotpotQA) [Dashed Purple]:** Starts near 0, rises to a peak of ~95 around layer 12, then shows a more gradual decline than in v0.1, ending near 70 at layer 30.
* **Q-Anchored (NQ) [Dashed Pink]:** Starts near 0, rises to a peak of ~85 around layer 8, then declines, ending near 50 at layer 30. Shows slightly better late-layer performance than v0.1.
* **A-Anchored Lines (All Dashed):** The pattern is similar to v0.1, with all A-Anchored series performing worse than Q-Anchored ones. They start in the 20-60 range and trend slightly downward or flat, clustering between 20-40 by layer 30. The separation between the different A-Anchored datasets appears slightly less pronounced than in v0.1.
### Key Observations
1. **Anchoring Method Dominance:** Across both model versions and all four datasets, the **Q-Anchored** evaluation method consistently yields dramatically higher answer accuracy than the **A-Anchored** method. This is the most salient trend.
2. **Dataset Difficulty:** For Q-Anchored evaluation, **TriviaQA** (green) appears to be the "easiest" dataset, achieving near-perfect accuracy very early (by layer 5) and maintaining it. **PopQA** (blue) is also high-performing. **HotpotQA** (purple) and **NQ** (pink) show more pronounced performance degradation in later layers.
3. **Model Version Comparison (v0.1 vs. v0.3):** The v0.3 model shows improved stability in the Q-Anchored performance for **PopQA** and **HotpotQA** in the later layers (15-30), with less dramatic drops compared to v0.1. The performance on **TriviaQA** is consistently excellent in both versions.
4. **Layer-wise Trend:** For Q-Anchored methods, accuracy typically rises sharply in the first 5-10 layers, peaks, and then either stabilizes (TriviaQA, PopQA in v0.3) or gradually declines (HotpotQA, NQ). A-Anchored methods show no clear early-layer rise and remain in a lower, noisier band.
5. **Uncertainty/Variance:** The shaded regions around each line indicate variance in the measurements. The variance appears generally larger for the A-Anchored methods and for the Q-Anchored methods on the more challenging datasets (HotpotQA, NQ) in later layers.
### Interpretation
This data strongly suggests that the **evaluation paradigm (Q-Anchored vs. A-Anchored) is a critical factor** in measuring the factual recall capabilities of the Mistral-7B model across its layers. The Q-Anchored setup, which likely provides the question as context, allows the model to access and utilize its parametric knowledge much more effectively, especially in the middle layers (5-15).
The difference between datasets indicates varying levels of complexity or alignment with the model's training data. TriviaQA's consistently high performance suggests its questions are well-represented in the model's pre-training. The decline in accuracy for HotpotQA and NQ in later layers might indicate that the knowledge for these more complex or specific questions is stored in or accessible primarily through middle layers, and later layers may be more specialized for other tasks (like reasoning or language modeling), potentially "overwriting" or not maintaining pure recall.
The improvement in stability from v0.1 to v0.3 for certain datasets suggests that the model update may have led to a more robust or consistent internal representation of factual knowledge across its depth. The stark contrast between anchoring methods highlights the importance of careful experimental design when probing neural networks; the choice of prompt format can lead to vastly different conclusions about a model's internal knowledge organization.
DECODING INTELLIGENCE...