## Line Graphs: Answer Accuracy Across Layers for Mistral-7B Models
### Overview
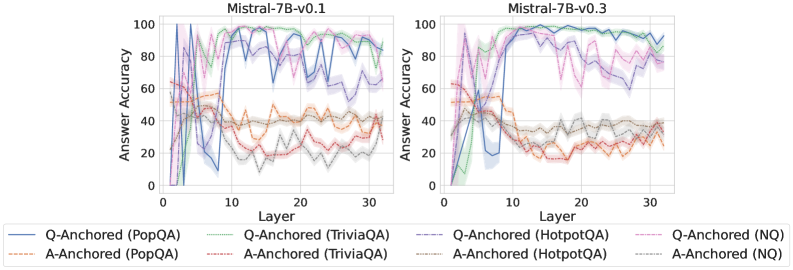
The image contains two side-by-side line graphs comparing answer accuracy across transformer model layers (0-30) for two versions of Mistral-7B (v0.1 and v0.3). Each graph shows multiple data series representing different anchoring methods (Q-Anchored/A-Anchored) and datasets (PopQA, TriviaQA, HotpotQA, NQ). The graphs use color-coded lines with shaded confidence intervals.
### Components/Axes
- **Y-Axis**: Answer Accuracy (0-100%) with ticks at 0, 20, 40, 60, 80, 100
- **X-Axis**: Layer (0-30) with ticks at 0, 10, 20, 30
- **Legends**:
- **Left Graph (v0.1)**:
- Solid blue: Q-Anchored (PopQA)
- Dashed green: Q-Anchored (TriviaQA)
- Dotted orange: A-Anchored (PopQA)
- Dash-dot red: A-Anchored (TriviaQA)
- Gray shaded area: Confidence intervals
- **Right Graph (v0.3)**:
- Solid purple: Q-Anchored (HotpotQA)
- Dashed pink: Q-Anchored (NQ)
- Dotted gray: A-Anchored (HotpotQA)
- Dash-dot brown: A-Anchored (NQ)
- Gray shaded area: Confidence intervals
### Detailed Analysis
**Mistral-7B-v0.1 (Left Graph)**
1. **Q-Anchored (PopQA)** (solid blue):
- Starts at ~95% accuracy (Layer 0), drops sharply to ~60% (Layer 5), then stabilizes between 70-85% with minor fluctuations
2. **Q-Anchored (TriviaQA)** (dashed green):
- Begins at ~80%, dips to ~50% (Layer 5), then rises to ~90% (Layer 20) before declining to ~75%
3. **A-Anchored (PopQA)** (dotted orange):
- Starts at ~40%, fluctuates between 30-50% until Layer 15, then stabilizes at ~45%
4. **A-Anchored (TriviaQA)** (dash-dot red):
- Begins at ~30%, rises to ~50% (Layer 10), drops to ~20% (Layer 15), then stabilizes at ~35%
**Mistral-7B-v0.3 (Right Graph)**
1. **Q-Anchored (HotpotQA)** (solid purple):
- Starts at ~70%, drops to ~50% (Layer 5), then rises to ~90% (Layer 15) before declining to ~80%
2. **Q-Anchored (NQ)** (dashed pink):
- Begins at ~60%, fluctuates between 50-70% until Layer 20, then stabilizes at ~65%
3. **A-Anchored (HotpotQA)** (dotted gray):
- Starts at ~35%, rises to ~55% (Layer 10), drops to ~40% (Layer 15), then stabilizes at ~45%
4. **A-Anchored (NQ)** (dash-dot brown):
- Begins at ~25%, rises to ~45% (Layer 10), drops to ~30% (Layer 15), then stabilizes at ~35%
### Key Observations
1. **Version Differences**: v0.3 shows more stable performance (smaller fluctuations) compared to v0.1
2. **Dataset Performance**:
- PopQA consistently shows highest accuracy in v0.1
- NQ shows lowest accuracy across both versions
3. **Anchoring Method Impact**:
- Q-Anchored methods generally outperform A-Anchored in both versions
- TriviaQA shows most dramatic fluctuations in v0.1
4. **Confidence Intervals**: Gray shaded areas indicate ~±5% uncertainty in all versions
### Interpretation
The data suggests that:
1. **Model Version Improvements**: v0.3 demonstrates more consistent layer performance, particularly for Q-Anchored methods
2. **Dataset-Specific Behavior**:
- PopQA's question-answer structure may better align with Q-Anchored methods
- NQ's complex reasoning requirements might challenge both anchoring approaches
3. **Layer Sensitivity**: Early layers (0-10) show highest variability, with performance stabilizing after Layer 15
4. **Anchoring Method Tradeoffs**: While Q-Anchored generally performs better, A-Anchored methods show more consistent mid-range performance
The graphs highlight the importance of anchoring strategy selection based on both model version and target dataset characteristics. The confidence intervals suggest measurement uncertainty, particularly in early layers where performance is most volatile.