# Technical Document Analysis of Entity Frequency Chart
## Labels and Axis Titles
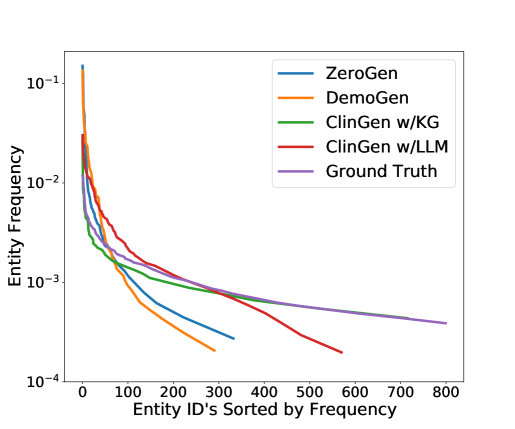
- **X-Axis**: "Entity ID's Sorted by Frequency" (ranges from 0 to 800)
- **Y-Axis**: "Entity Frequency" (logarithmic scale, 10⁻⁴ to 10⁻¹)
- **Legend Entries**:
- ZeroGen (blue line)
- DemoGen (orange line)
- ClinGen w/KG (green line)
- ClinGen w/LLM (red line)
- Ground Truth (purple line)
## Key Trends and Data Points
1. **Initial Sharp Decline**:
- All models exhibit a steep drop in entity frequency for the first ~100 entity IDs, indicating a long-tail distribution where a small number of entities dominate frequency.
- **DemoGen (orange)** shows the steepest initial decline, suggesting it prioritizes fewer high-frequency entities more aggressively than other models.
2. **Mid-Range Performance**:
- **ClinGen w/LLM (red)** and **ClinGen w/KG (green)** closely track the **Ground Truth (purple)** between entity IDs 100–500, indicating better alignment with real-world frequency distributions.
- **ZeroGen (blue)** lags behind ClinGen variants in this range, with a slower decline.
3. **Long-Tail Behavior**:
- Beyond entity ID 500, all lines converge toward lower frequencies, but **ClinGen w/LLM (red)** maintains a slight edge over **ClinGen w/KG (green)**, suggesting LLM integration improves rare entity coverage.
- **Ground Truth (purple)** remains the highest-frequency baseline across all entity IDs, serving as the reference for optimal performance.
4. **Model Comparisons**:
- **DemoGen (orange)** and **ZeroGen (blue)** diverge significantly from the Ground Truth, particularly for entity IDs >300, indicating suboptimal generalization.
- **ClinGen w/LLM (red)** achieves the closest approximation to Ground Truth, especially in the 200–600 range.
## Logarithmic Scale Implications
- The y-axis uses a logarithmic scale, emphasizing differences in frequency magnitude. For example:
- Entity ID 0–10: Frequencies range from ~10⁻¹ to 10⁻².
- Entity ID 100–200: Frequencies drop to ~10⁻³.
- Entity ID 500–800: Frequencies approach ~10⁻⁴.
## Critical Observations
- **ClinGen w/LLM (red)** demonstrates superior performance in mimicking Ground Truth frequency distributions, particularly for mid-to-high frequency entities.
- **DemoGen (orange)** and **ZeroGen (blue)** underperform in capturing the long-tail behavior, likely due to architectural or training limitations.
- All models struggle with rare entities (ID >500), but ClinGen variants retain higher frequencies in this range compared to baselines.
## Conclusion
The chart highlights the effectiveness of ClinGen with LLM integration in replicating real-world entity frequency distributions, outperforming ZeroGen and DemoGen. The logarithmic scale underscores the dominance of high-frequency entities and the challenges models face in capturing rare entities.