## Line Charts: 1-shot and 5-shot Accuracy vs. Training Classes per Episode
### Overview
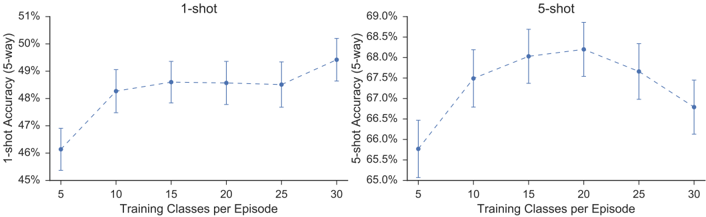
This image displays two side-by-side line charts illustrating the performance of a machine learning model (likely a few-shot learning model) across different training configurations. The charts compare "Training Classes per Episode" (ranging from 5 to 30) against model accuracy for two distinct tasks: "1-shot" and "5-shot" classification, both evaluated on a "5-way" task.
### Components/Axes
**Left Chart: 1-shot**
* **Title:** 1-shot
* **X-Axis:** "Training Classes per Episode" with markers at 5, 10, 15, 20, 25, 30.
* **Y-Axis:** "1-shot Accuracy (5-way)" with a scale from 45% to 51% in 1% increments.
* **Data Series:** A dashed line connecting blue circular data points, each featuring vertical error bars.
**Right Chart: 5-shot**
* **Title:** 5-shot
* **X-Axis:** "Training Classes per Episode" with markers at 5, 10, 15, 20, 25, 30.
* **Y-Axis:** "5-shot Accuracy (5-way)" with a scale from 65.0% to 69.0% in 0.5% increments.
* **Data Series:** A dashed line connecting blue circular data points, each featuring vertical error bars.
---
### Detailed Analysis
#### Left Chart (1-shot)
The chart shows a general upward trend in accuracy as the number of training classes per episode increases.
* At 5 classes, accuracy is approximately 46%.
* The accuracy rises steadily, reaching approximately 50% at 30 classes.
#### Right Chart (5-shot)
The chart shows a similar upward trend in accuracy as the number of training classes per episode increases.
* At 5 classes, accuracy is approximately 66%.
* The accuracy rises steadily, reaching approximately 68.5% at 30 classes.