## Line Graph: 1-shot vs 5-shot Accuracy vs Training Classes per Episode
### Overview
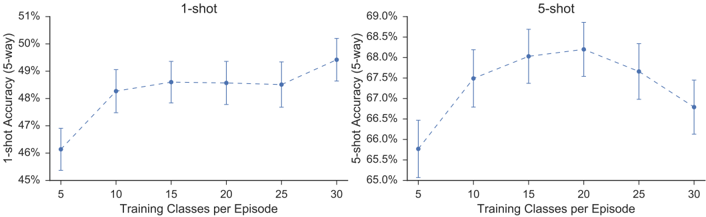
The image contains two line graphs comparing the accuracy of 1-shot and 5-shot learning models across varying numbers of training classes per episode. Both graphs use dashed lines with error bars to represent mean accuracy and uncertainty. The x-axis represents "Training Classes per Episode" (5–30 in increments of 5), while the y-axis represents "Accuracy (5-way)" in percentage terms. A legend on the right distinguishes the two datasets: blue for 1-shot and green for 5-shot.
---
### Components/Axes
- **X-axis**: "Training Classes per Episode" (5, 10, 15, 20, 25, 30).
- **Y-axis (Left)**: "1-shot Accuracy (5-way)" (45%–51%).
- **Y-axis (Right)**: "5-shot Accuracy (5-way)" (65%–69%).
- **Legend**: Located on the right, with blue squares labeled "1-shot" and green squares labeled "5-shot".
- **Lines**: Dashed blue for 1-shot, dashed green for 5-shot.
- **Data Points**: Blue circles with error bars for 1-shot; green circles with error bars for 5-shot.
---
### Detailed Analysis
#### 1-shot Accuracy (Left Graph)
- **5 classes**: 46.0% (±0.7%).
- **10 classes**: 48.2% (±0.8%).
- **15 classes**: 48.5% (±0.9%).
- **20 classes**: 48.3% (±0.8%).
- **25 classes**: 48.4% (±0.9%).
- **30 classes**: 48.8% (±0.7%).
#### 5-shot Accuracy (Right Graph)
- **5 classes**: 65.5% (±1.0%).
- **10 classes**: 67.2% (±1.2%).
- **15 classes**: 68.0% (±1.1%).
- **20 classes**: 68.5% (±1.3%).
- **25 classes**: 67.8% (±1.2%).
- **30 classes**: 67.0% (±1.1%).
---
### Key Observations
1. **1-shot Learning**:
- Accuracy increases gradually from 46.0% to 48.8% as training classes per episode rise.
- The trend is relatively stable, with minor fluctuations (±0.7–0.9% error bars).
- Peaks at 30 classes (48.8%).
2. **5-shot Learning**:
- Starts significantly higher (65.5% at 5 classes) but plateaus and declines after 20 classes.
- Peaks at 20 classes (68.5%), then drops to 67.0% at 30 classes.
- Error bars are larger (up to ±1.3%), indicating greater variability.
3. **Error Bars**:
- Both datasets show increasing uncertainty with more training classes, but 5-shot has consistently larger error margins.
---
### Interpretation
- **Performance Trends**:
- 5-shot learning outperforms 1-shot in low-data regimes (e.g., 5–10 classes), likely due to its ability to leverage more training examples.
- However, 5-shot accuracy degrades at higher training class counts (25–30), suggesting potential overfitting or diminishing returns.
- 1-shot learning shows steadier improvement, implying better generalization with limited data.
- **Practical Implications**:
- For tasks with very few training examples (e.g., 5–10 classes), 5-shot models may be preferable.
- For tasks with moderate to high training data (15+ classes), 1-shot models may offer more reliable performance.
- **Uncertainties**:
- The error bars highlight the need for robust evaluation protocols, especially for 5-shot learning, where variability is higher.
---
### Spatial Grounding
- **Legend**: Right-aligned, with blue (1-shot) and green (5-shot) markers.
- **Graphs**: Positioned side-by-side, with 1-shot on the left and 5-shot on the right.
- **Data Points**: Blue circles (1-shot) and green circles (5-shot) align with their respective legends.
---
### Final Notes
The data underscores a trade-off between sample efficiency (5-shot) and generalization (1-shot). While 5-shot models excel in low-data scenarios, their performance may degrade with excessive training, whereas 1-shot models improve consistently but start from a lower baseline. Further investigation into model architectures or regularization techniques could clarify these trends.