## Diagram: Simple Directed Graph
### Overview
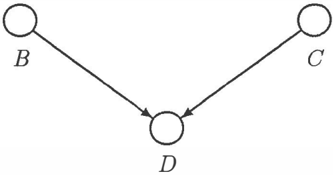
The image shows a simple directed graph with three nodes (B, C, and D) and two directed edges. Node B and Node C both have edges pointing towards Node D.
### Components/Axes
* **Nodes:** Three nodes labeled B, C, and D. Each node is represented by a circle.
* **Edges:** Two directed edges (arrows). One edge goes from node B to node D, and the other goes from node C to node D.
### Detailed Analysis
* **Node B:** Located in the top-left of the diagram.
* **Node C:** Located in the top-right of the diagram.
* **Node D:** Located in the bottom-center of the diagram.
* **Edge B -> D:** A directed edge originates from node B and points towards node D.
* **Edge C -> D:** A directed edge originates from node C and points towards node D.
### Key Observations
The graph illustrates a scenario where both B and C have a direct influence on D. There are no edges between B and C.
### Interpretation
This diagram represents a simple causal relationship where both B and C are causes or inputs that contribute to D. It could represent a variety of scenarios, such as:
* B and C are inputs to a process that results in D.
* B and C are factors that influence the outcome D.
* B and C are events that lead to event D.