\n
## Diagram: Directed Acyclic Graph
### Overview
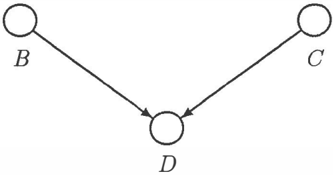
The image depicts a directed acyclic graph (DAG) consisting of four nodes labeled B, C, and D. Arrows indicate the direction of relationships between the nodes. Node D receives input from both nodes B and C.
### Components/Axes
The diagram consists of:
* **Nodes:** B, C, D. Each node is represented by a circle.
* **Edges:** Directed arrows connecting the nodes.
* An arrow originates from B and points to D.
* An arrow originates from C and points to D.
### Detailed Analysis or Content Details
* **Node B:** Located in the top-left of the image. It has a single outgoing edge pointing to node D.
* **Node C:** Located in the top-right of the image. It has a single outgoing edge pointing to node D.
* **Node D:** Located in the bottom-center of the image. It has two incoming edges, one from B and one from C. It has no outgoing edges.
### Key Observations
The diagram illustrates a convergence pattern where two independent inputs (B and C) are combined into a single output (D). There is no cyclical dependency, confirming it is a directed acyclic graph.
### Interpretation
This diagram likely represents a simple dependency or flow model. Node D represents a process or entity that requires input from both B and C to function or produce an output. The arrows indicate the direction of influence or data flow. For example, B and C could represent two different data sources that are combined to generate a result in D. The diagram does not provide any quantitative data or specific details about the nature of the relationships, but it clearly shows the structural dependencies between the nodes. It could represent a logical AND operation, where D is only active if both B and C are active.