## Directed Graph Diagram: Convergent Flow Structure
### Overview
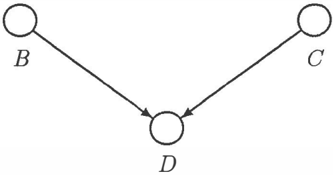
The image displays a simple directed graph (or flowchart) consisting of three circular nodes connected by two directed edges (arrows). The diagram illustrates a convergent flow where two separate source nodes point to a single destination node. The entire diagram is monochrome, rendered in black lines on a white background.
### Components/Axes
* **Nodes:** Three circular nodes, each labeled with a single uppercase letter.
* **Node B:** Positioned in the top-left quadrant of the image.
* **Node C:** Positioned in the top-right quadrant of the image.
* **Node D:** Positioned in the bottom-center of the image, below and between nodes B and C.
* **Edges (Arrows):** Two straight lines with arrowheads indicating direction.
* **Edge from B to D:** A straight line originating from the bottom of Node B and terminating with an arrowhead pointing to the top-left side of Node D.
* **Edge from C to D:** A straight line originating from the bottom of Node C and terminating with an arrowhead pointing to the top-right side of Node D.
* **Labels:** The only text present are the labels for the nodes: "B", "C", and "D". No axis titles, legends, or numerical data are present.
### Detailed Analysis
The diagram's structure is symmetrical and hierarchical.
* **Spatial Layout:** The two source nodes (B and C) are placed at the same vertical level (top), separated horizontally. The target node (D) is placed centrally below them, creating a triangular or V-shaped composition.
* **Flow Direction:** The arrows establish a clear, unidirectional flow of information, dependency, or process from the top nodes (B and C) to the bottom node (D). This represents a many-to-one or convergent relationship.
* **Visual Elements:** All nodes are identical in size and shape (simple circles). The connecting lines are of uniform thickness. There is no variation in color, line style, or node shape to indicate different types of entities or relationships.
### Key Observations
1. **Symmetry:** The diagram exhibits bilateral symmetry along a vertical axis running through Node D. The positions of B and C are mirror images, as are the angles and lengths of the connecting arrows.
2. **Convergence:** The primary structural feature is the convergence of two distinct paths into a single point (Node D). This is the central visual and conceptual message.
3. **Simplicity and Abstraction:** The diagram uses minimal, abstract symbols (circles, lines, letters). It contains no specific context, labels for the relationships, or quantitative data. Its meaning is entirely dependent on the interpretation of the labels B, C, and D within a larger system.
### Interpretation
This diagram is a foundational representation of a **convergent system** or a **dependency structure**.
* **What it Suggests:** It models a scenario where two independent entities, processes, or data sources (B and C) both contribute to, influence, or feed into a single downstream entity, process, or result (D). This is a common pattern in:
* **Causal Models:** Where B and C are causes and D is an effect.
* **Data Flow:** Where B and C are inputs to a function or process D.
* **Organizational Charts:** Where B and C are subordinates or departments reporting to a manager D.
* **Logical Arguments:** Where B and C are premises supporting a conclusion D.
* **Relationship Between Elements:** The relationship is strictly directional and non-cyclical. There is no feedback loop from D back to B or C. The diagram implies that D's state or existence is dependent on B and C, but not necessarily vice-versa.
* **Notable Absence:** The lack of labels on the arrows is significant. It abstracts away the *nature* of the relationship (e.g., "causes," "provides data to," "reports to"), focusing solely on the *existence* and *direction* of the connection. This makes the diagram a versatile template applicable to many fields.
* **Peircean Investigative Reading:** As a sign, this diagram is an **icon** (it resembles the structure it represents) and a **symbol** (the letters B, C, D stand for arbitrary concepts). The arrows are **indexical signs**, pointing directly from cause to effect. The viewer is invited to interpret the underlying system by assigning meaning to the symbols B, C, and D. The diagram's power lies in its abstraction, allowing it to model the deep structure of countless real-world phenomena where multiple factors combine to produce a single outcome.