## Diagram: Nested Equations
### Overview
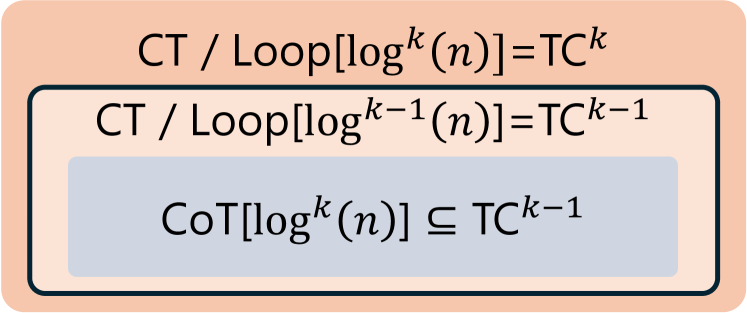
The image presents a diagram of nested equations, visually represented as boxes within boxes. The equations relate computational time (CT), loop iterations, and time complexity (TC).
### Components/Axes
* **Outer Box (Peach):** Contains the equation `CT / Loop[log^k(n)] = TC^k`
* **Middle Box (Peach):** Contains the equation `CT / Loop[log^(k-1)(n)] = TC^(k-1)`
* **Inner Box (Light Blue):** Contains the inequality `CoT[log^k(n)] ⊆ TC^(k-1)`
### Detailed Analysis
* **Outer Box:** The equation `CT / Loop[log^k(n)] = TC^k` suggests that the computational time (CT) divided by the number of loop iterations, where the loop iterates over a logarithmic function of n raised to the power of k, equals the time complexity (TC) raised to the power of k.
* **Middle Box:** The equation `CT / Loop[log^(k-1)(n)] = TC^(k-1)` is similar to the outer box equation, but with the exponent reduced by 1. This suggests a relationship between the number of loop iterations and the resulting time complexity.
* **Inner Box:** The inequality `CoT[log^k(n)] ⊆ TC^(k-1)` indicates that the cost of a task (CoT) involving a logarithmic function of n raised to the power of k is a subset of the time complexity (TC) raised to the power of (k-1).
### Key Observations
* The diagram illustrates a hierarchical relationship between computational time, loop iterations, and time complexity.
* The exponents 'k' and 'k-1' play a crucial role in defining the relationships between these elements.
* The subset symbol (⊆) in the inner box suggests that the cost of a task is bounded by the time complexity.
### Interpretation
The diagram likely represents a simplified model of algorithm analysis, where the computational time is influenced by the number of loop iterations and the resulting time complexity. The nested structure suggests that as the exponent 'k' decreases, the time complexity also decreases, potentially leading to more efficient algorithms. The inequality in the inner box highlights the concept that the cost of a task is always less than or equal to the overall time complexity. The diagram could be used to explain the relationship between different algorithmic complexities and how they are affected by loop iterations.