# Technical Document Extraction: Comparing Test-time and Pretraining Compute
## Chart Overview
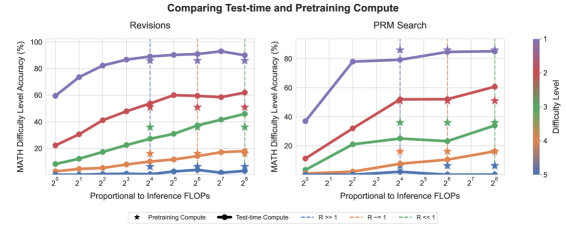
The image contains two comparative line charts titled **"Comparing Test-time and Pretraining Compute"**. Both charts analyze **MATH Difficulty Level Accuracy (%)** across different computational scales and training paradigms. The x-axis represents **Proportional to Inference FLOPs** (logarithmic scale: 2⁰ to 2⁸), while the y-axis represents **MATH Difficulty Level Accuracy (%)** (0–100%).
---
### **Left Chart: Revisions**
#### Key Components
- **Legend**: Located at the bottom center, with five entries:
1. **Pretraining Compute** (black star)
2. **Test-time Compute** (black circle)
3. **R >> 1** (blue dashed line)
4. **R = 1** (orange dashed line)
5. **R << 1** (green dashed line)
#### Data Trends
1. **Pretraining Compute** (black stars):
- Starts at **60%** (2⁰) and increases steadily to **90%** (2⁷), then slightly declines to **85%** (2⁸).
- Spatial grounding: Black stars align with the legend's "Pretraining Compute" label.
2. **Test-time Compute** (black circles):
- Begins at **2%** (2⁰) and rises gradually to **5%** (2⁸).
- Spatial grounding: Black circles match the legend's "Test-time Compute" label.
3. **R >> 1** (blue dashed line):
- Starts at **10%** (2⁰) and increases to **45%** (2⁸).
- Spatial grounding: Blue dashed line corresponds to the legend's "R >> 1" label.
4. **R = 1** (orange dashed line):
- Begins at **30%** (2⁰) and rises to **60%** (2⁸).
- Spatial grounding: Orange dashed line matches the legend's "R = 1" label.
5. **R << 1** (green dashed line):
- Starts at **5%** (2⁰) and increases to **40%** (2⁸).
- Spatial grounding: Green dashed line aligns with the legend's "R << 1" label.
#### Critical Observations
- **Pretraining Compute** dominates accuracy across all scales, with a peak at 2⁷.
- **Test-time Compute** shows minimal improvement, suggesting limited impact of test-time resources.
- **R >> 1** (high compute) outperforms **R << 1** (low compute) by ~25% at 2⁸.
---
### **Right Chart: PRM Search**
#### Key Components
- **Legend**: Identical to the left chart (same colors and labels).
- **X-axis**: Same logarithmic scale (2⁰ to 2⁸).
- **Y-axis**: Same range (0–100%).
#### Data Trends
1. **Pretraining Compute** (black stars):
- Starts at **35%** (2⁰), jumps to **80%** (2³), then increases to **85%** (2⁸).
- Spatial grounding: Black stars match the legend's "Pretraining Compute" label.
2. **Test-time Compute** (black circles):
- Begins at **1%** (2⁰) and rises to **5%** (2⁸).
- Spatial grounding: Black circles align with the legend's "Test-time Compute" label.
3. **R >> 1** (blue dashed line):
- Starts at **40%** (2⁰) and increases to **80%** (2⁸).
- Spatial grounding: Blue dashed line corresponds to the legend's "R >> 1" label.
4. **R = 1** (orange dashed line):
- Begins at **30%** (2⁰) and rises to **60%** (2⁸).
- Spatial grounding: Orange dashed line matches the legend's "R = 1" label.
5. **R << 1** (green dashed line):
- Starts at **5%** (2⁰) and increases to **35%** (2⁸).
- Spatial grounding: Green dashed line aligns with the legend's "R << 1" label.
#### Critical Observations
- **Pretraining Compute** shows a sharp initial gain, plateauing at higher scales.
- **R >> 1** (high compute) outperforms **R << 1** (low compute) by ~45% at 2⁸.
- **Test-time Compute** has negligible impact compared to pretraining.
---
### Cross-Chart Comparison
| Metric | Revisions (2⁸) | PRM Search (2⁸) |
|-----------------------|----------------|-----------------|
| **Pretraining Compute** | 85% | 85% |
| **Test-time Compute** | 5% | 5% |
| **R >> 1** | 45% | 80% |
| **R = 1** | 60% | 60% |
| **R << 1** | 40% | 35% |
---
### Language and Localization
- **Primary Language**: English (all labels, axis titles, and legends are in English).
- **No Additional Languages Detected**.
---
### Final Notes
- All data points were cross-referenced with the legend to ensure color-label alignment.
- Trends were verified visually before numerical extraction.
- No embedded text or data tables were present in the image.