# Technical Diagram Analysis
## Overview
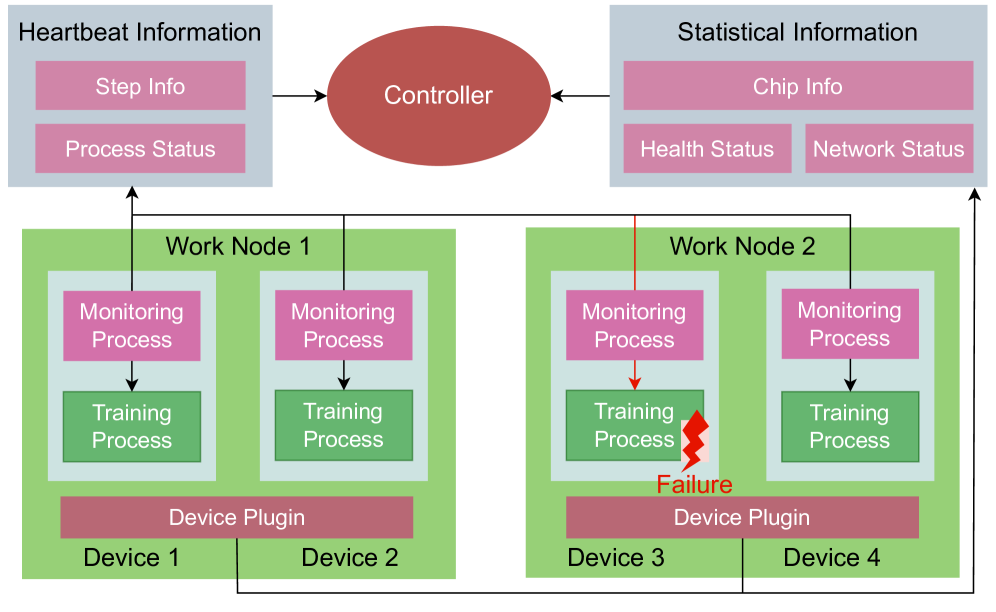
The diagram depicts a distributed system architecture with a central controller coordinating multiple work nodes and devices. Key components include data flow between monitoring/training processes, device plugins, and system status monitoring.
## Component Breakdown
### Central Controller
- **Function**: Central processing unit
- **Connections**:
- Receives `Heartbeat Information` from Work Nodes
- Sends `Statistical Information` to Work Nodes
- **Data Flow**:
- Input: Step Info, Process Status
- Output: Chip Info, Health Status, Network Status
### Work Nodes
#### Work Node 1
- **Components**:
- **Monitoring Process**: Receives data from Controller
- **Training Process**: Receives data from Monitoring Process
- **Devices**:
- Device 1
- Device 2
- **Interface**: Device Plugin
#### Work Node 2
- **Components**:
- **Monitoring Process**: Receives data from Controller
- **Training Process**: Receives data from Monitoring Process
- **Devices**:
- Device 3
- Device 4
- **Interface**: Device Plugin
- **Failure Indicator**: Red lightning bolt symbol between Monitoring and Training Processes
### Data Flow Paths
1. **Heartbeat Information Path**:
- Work Node → Controller (Step Info, Process Status)
2. **Statistical Information Path**:
- Controller → Work Node (Chip Info, Health Status, Network Status)
3. **Training Process Path**:
- Monitoring Process → Training Process (Devices 1-4)
## System Status Monitoring
- **Heartbeat Information**:
- Tracks operational status of training processes
- **Statistical Information**:
- Chip performance metrics
- System health indicators
- Network connectivity status
## Device Architecture
- **Device Plugins**:
- Act as intermediaries between physical devices and system processes
- Support multiple device types (Devices 1-4 shown)
## Failure Handling
- **Visual Indicator**: Red lightning bolt in Work Node 2
- **Implication**: Potential disruption in data flow between Monitoring and Training Processes
## Color Coding
- **Red**: Critical components/failure indicators
- **Green**: Training processes
- **Pink**: Monitoring processes
- **Gray**: Controller
- **Blue**: Device plugins
## System Hierarchy
1. Controller (Top-level)
2. Work Nodes (Intermediate)
- Monitoring Processes
- Training Processes
3. Devices (Peripheral)
- Connected via Device Plugins
## Data Flow Logic
- All Work Nodes maintain bidirectional communication with Controller
- Training Processes depend on successful Monitoring Process operation
- Failure in Work Node 2 suggests potential system-wide impact
## Technical Implications
- Distributed architecture enables parallel processing
- Centralized control ensures system-wide coordination
- Monitoring processes act as quality gates for training data
- Failure detection mechanism identifies process disruptions