\n
## Diagram: Object Rearrangement Scenario
### Overview
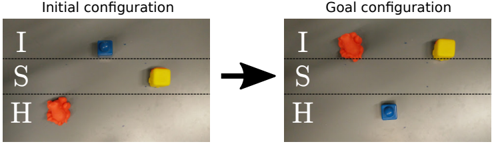
The image depicts a before-and-after scenario of an object rearrangement task. Two configurations are shown side-by-side, labeled "Initial configuration" and "Goal configuration". The configurations involve three distinct colored objects (red, blue, and yellow) positioned on a gray surface with horizontal lines acting as guides. An arrow indicates the transformation from the initial to the goal state.
### Components/Axes
The diagram consists of two square images, each representing a configuration. Each image has three labeled vertical axes:
* **I** (Top)
* **S** (Middle)
* **H** (Bottom)
The objects are differentiated by color:
* Red
* Blue
* Yellow
### Detailed Analysis or Content Details
**Initial Configuration (Left Image):**
* The red object is located at the bottom (H) position. It appears to be irregularly shaped.
* The blue object is located at the top (I) position. It is a cube.
* The yellow object is located in the middle (S) position. It is a cube.
**Goal Configuration (Right Image):**
* The red object is located at the top (I) position. It appears to be irregularly shaped.
* The blue object is located at the bottom (H) position. It is a cube.
* The yellow object is located in the middle (S) position. It is a cube.
The arrow between the two configurations points from left to right, indicating the direction of the rearrangement.
### Key Observations
The rearrangement involves swapping the positions of the red and blue objects while the yellow object remains in the same position. The objects are positioned along the vertical axis, labeled I, S, and H.
### Interpretation
This diagram illustrates a simple object rearrangement task, potentially used in robotics or artificial intelligence research. The task requires moving objects from an initial state to a goal state. The labels I, S, and H likely represent different locations or states within the environment. The goal is to move the red object from H to I and the blue object from I to H, while keeping the yellow object in place. This type of task tests an agent's ability to plan and execute movements to achieve a specific configuration. The irregular shape of the red object might introduce additional challenges related to grasping and manipulation. The diagram is a visual representation of a problem statement, not a data-driven chart or graph. It does not contain numerical data or trends, but rather a qualitative description of a state transition.