## Network Diagram: Abstract Network Topology
### Overview
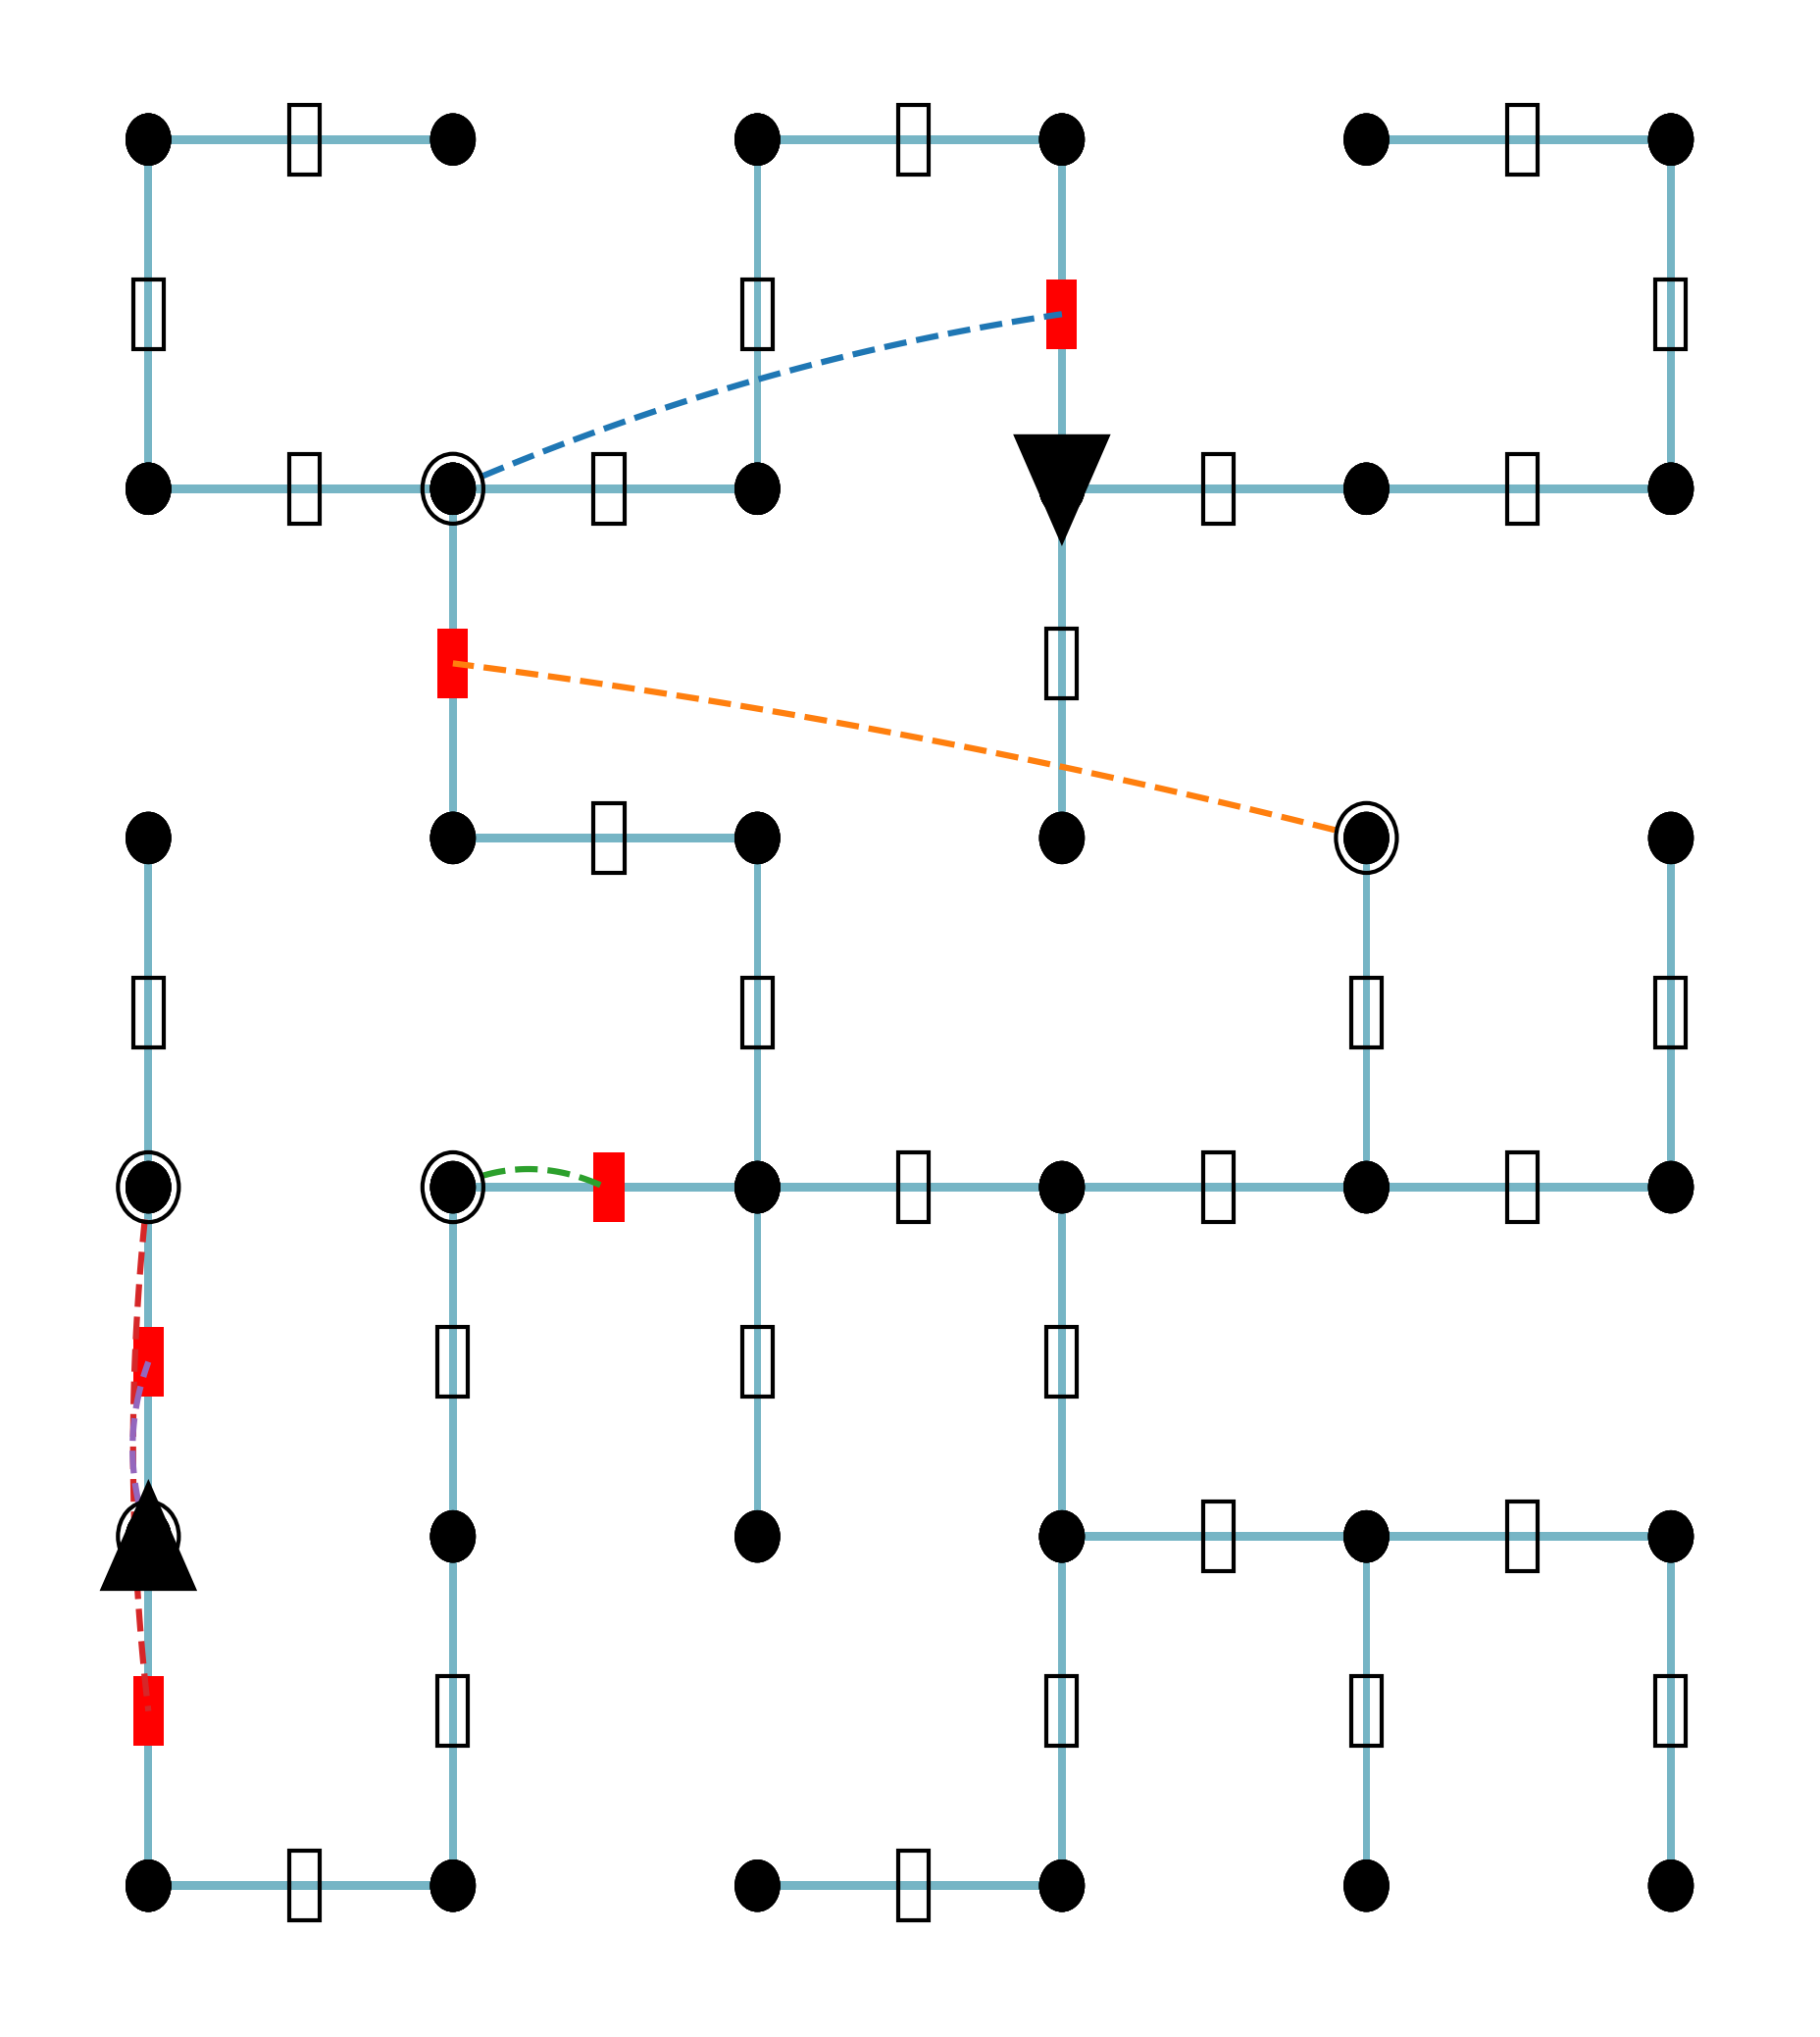
The image presents an abstract network topology diagram. It consists of nodes (represented by circles), connections (represented by light blue lines), and components (represented by rectangles). The diagram also includes directional indicators (triangles) and highlighted paths (dashed lines in various colors).
### Components/Axes
* **Nodes:** Represented by solid black circles. Some nodes have a circle around them.
* **Connections:** Represented by solid light blue lines.
* **Components:** Represented by white rectangles with black outlines.
* **Directional Indicators:** Represented by solid black triangles.
* **Highlighted Paths:** Represented by dashed lines in the following colors:
* Blue
* Orange
* Green
* Purple
* **Red Rectangles:** Small red rectangles are placed along some of the light blue lines.
### Detailed Analysis or ### Content Details
* **Nodes:** There are approximately 25 nodes in the diagram.
* **Connections:** The nodes are interconnected by light blue lines, forming a network.
* **Components:** Each light blue line segment has a white rectangle with a black outline.
* **Directional Indicators:** There are two black triangles in the diagram. One is pointing downwards in the top-center of the diagram, and the other is pointing upwards on the left side of the diagram.
* **Highlighted Paths:**
* A dashed blue line connects a node with a circle around it in the top-left to a red rectangle in the top-center.
* A dashed orange line connects a red rectangle in the center-left to a node with a circle around it in the center-right.
* A dashed green line connects a node with a circle around it in the center-left to a red rectangle to its right.
* A dashed purple line connects a red rectangle to a black triangle on the left side of the diagram.
* **Red Rectangles:** There are 5 red rectangles in the diagram.
### Key Observations
* The diagram shows a network with interconnected nodes and components.
* The highlighted paths indicate specific connections or routes within the network.
* The directional indicators suggest a flow or directionality within the network.
### Interpretation
The diagram likely represents an abstract model of a network, possibly a communication network, a transportation network, or an electrical circuit. The nodes could represent devices, locations, or connection points. The connections represent the links between these nodes. The components could represent resistors, switches, or other network elements. The highlighted paths could represent specific data flows, routes, or connections of interest. The directional indicators could represent the direction of data flow or current. The red rectangles could represent a specific type of component or a point of interest.