\n
## Diagram: Grid-Based Network with Node Variations
### Overview
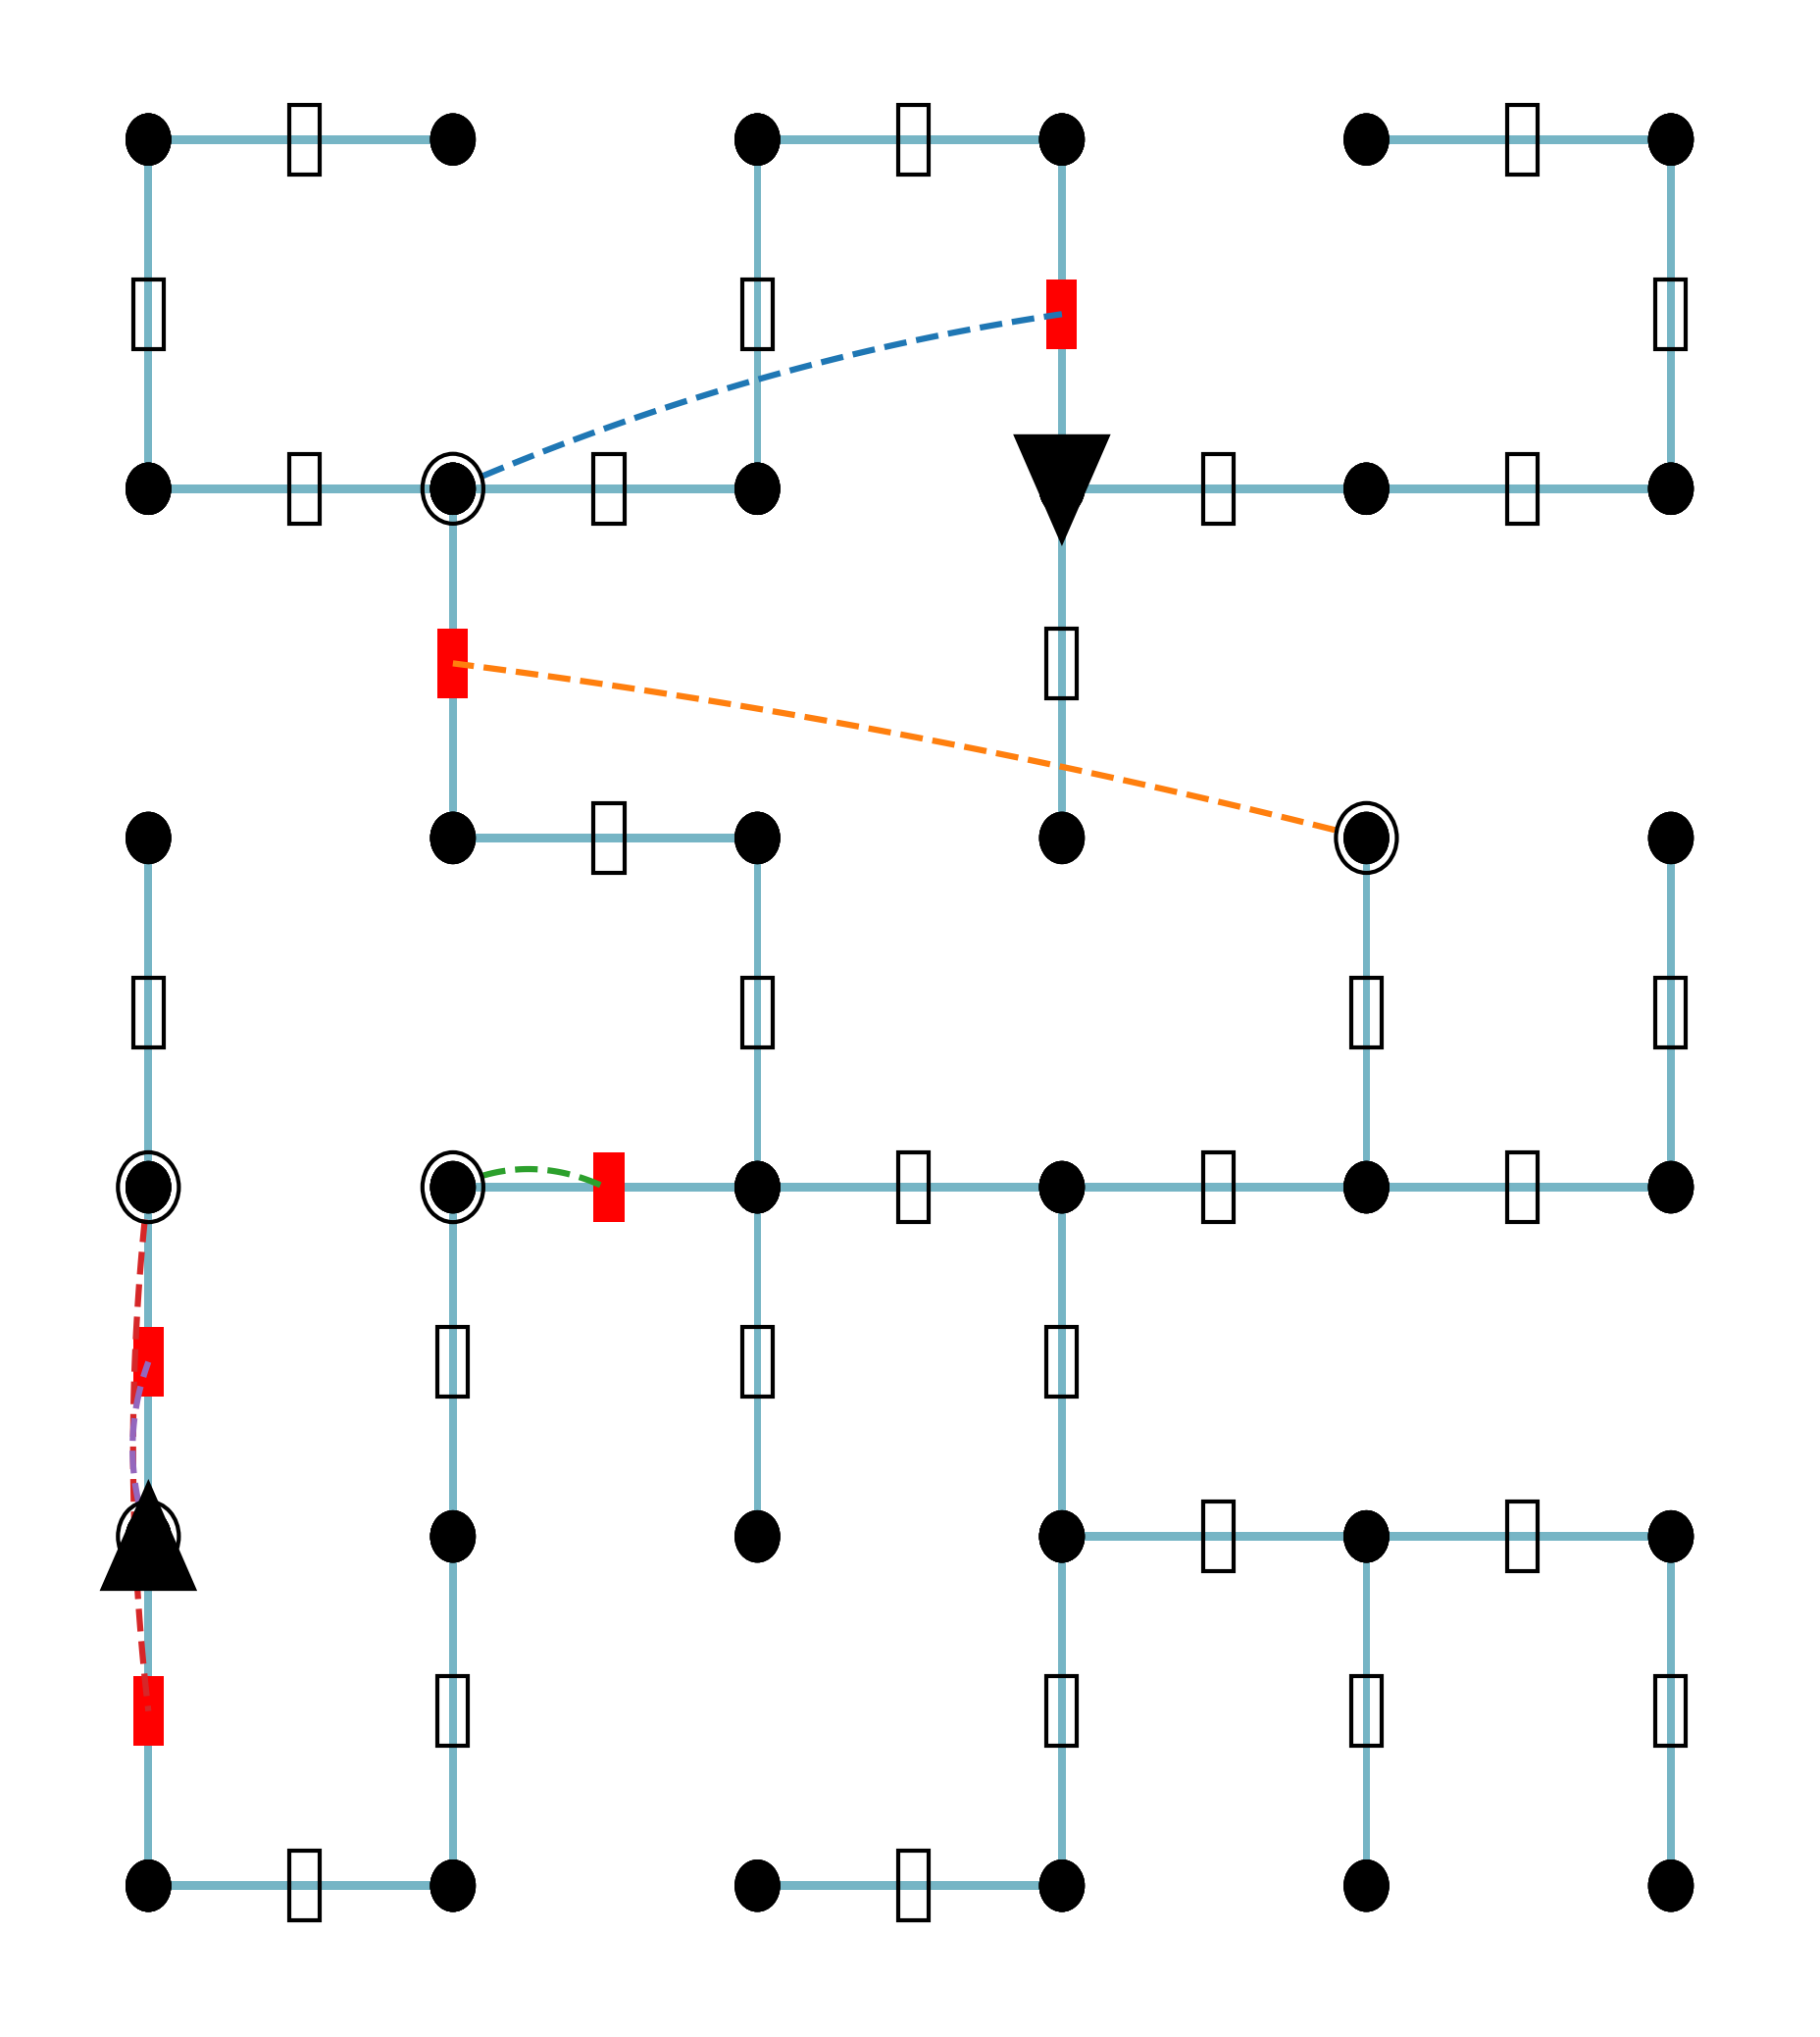
The image depicts a grid-based network composed of nodes connected by lines. The nodes vary in shape and color, suggesting different states or types. The network appears to be a visual representation of a system with pathways and potential decision points. There are no explicit axes or labels, so the interpretation relies on the visual cues provided by the node and line characteristics.
### Components/Axes
The diagram consists of:
* **Nodes:** Represented by circles and triangles.
* Black circles: Most frequent node type.
* Gray circles: Less frequent, larger in size.
* Red squares: Indicate a specific state or event.
* Black triangles: Indicate a specific state or event.
* **Lines:** Connect the nodes, indicating pathways or relationships.
* Solid lines: Represent standard connections.
* Dashed lines: Represent alternative or less direct connections.
* Blue dashed line: Connects two nodes.
* Orange dashed line: Connects two nodes.
* Green dashed line: Connects two nodes.
* Red dashed line: Connects two nodes.
### Detailed Analysis or Content Details
The diagram is structured as a grid, with nodes arranged in rows and columns. The connections between nodes are primarily horizontal and vertical, forming a network of pathways.
* **Top Row:** Contains black circles connected by solid lines. A red square is connected to the second node from the right via a blue dashed line.
* **Second Row:** Contains black circles connected by solid lines. A red square is connected to the second node from the left via an orange dashed line. A gray circle is connected to the fourth node from the right via a solid line.
* **Third Row:** Contains black circles connected by solid lines. A red square is connected to the second node from the left via a green dashed line. A gray circle is connected to the first node from the left via a red dashed line.
* **Fourth Row:** Contains black circles connected by solid lines.
* **Fifth Row:** Contains black circles connected by solid lines.
* **Leftmost Column:** Contains black circles connected by solid lines. A black triangle is connected to the second node from the top via a red dashed line. A gray circle is connected to the first node from the top via a solid line.
There are 3 red squares, 2 black triangles, and 2 gray circles.
### Key Observations
* The red squares appear to be "event" nodes, as they are connected to other nodes via dashed lines, suggesting a deviation from the standard pathway.
* The black triangles also appear to be "event" nodes, similar to the red squares.
* The gray circles are larger than the black circles, potentially indicating a higher priority or different function.
* The dashed lines suggest alternative routes or conditional connections within the network.
* The grid structure implies a systematic or organized system.
### Interpretation
The diagram likely represents a state machine, a flow chart, or a network with decision points. The black circles represent standard states, while the red squares and black triangles represent events or triggers that cause transitions to different states. The gray circles might represent important states or nodes that require special attention. The dashed lines indicate alternative paths or conditional transitions.
The overall structure suggests a system where a process flows through a series of states, with occasional events causing deviations or alternative pathways. The grid layout implies a well-defined and organized system. The lack of labels makes it difficult to determine the specific meaning of each state and event, but the visual cues provide a general understanding of the system's structure and behavior. The diagram could be used to model a variety of processes, such as a computer program, a manufacturing process, or a business workflow.