## Diagram: Grid-Based Network Flow with Directional Pathways
### Overview
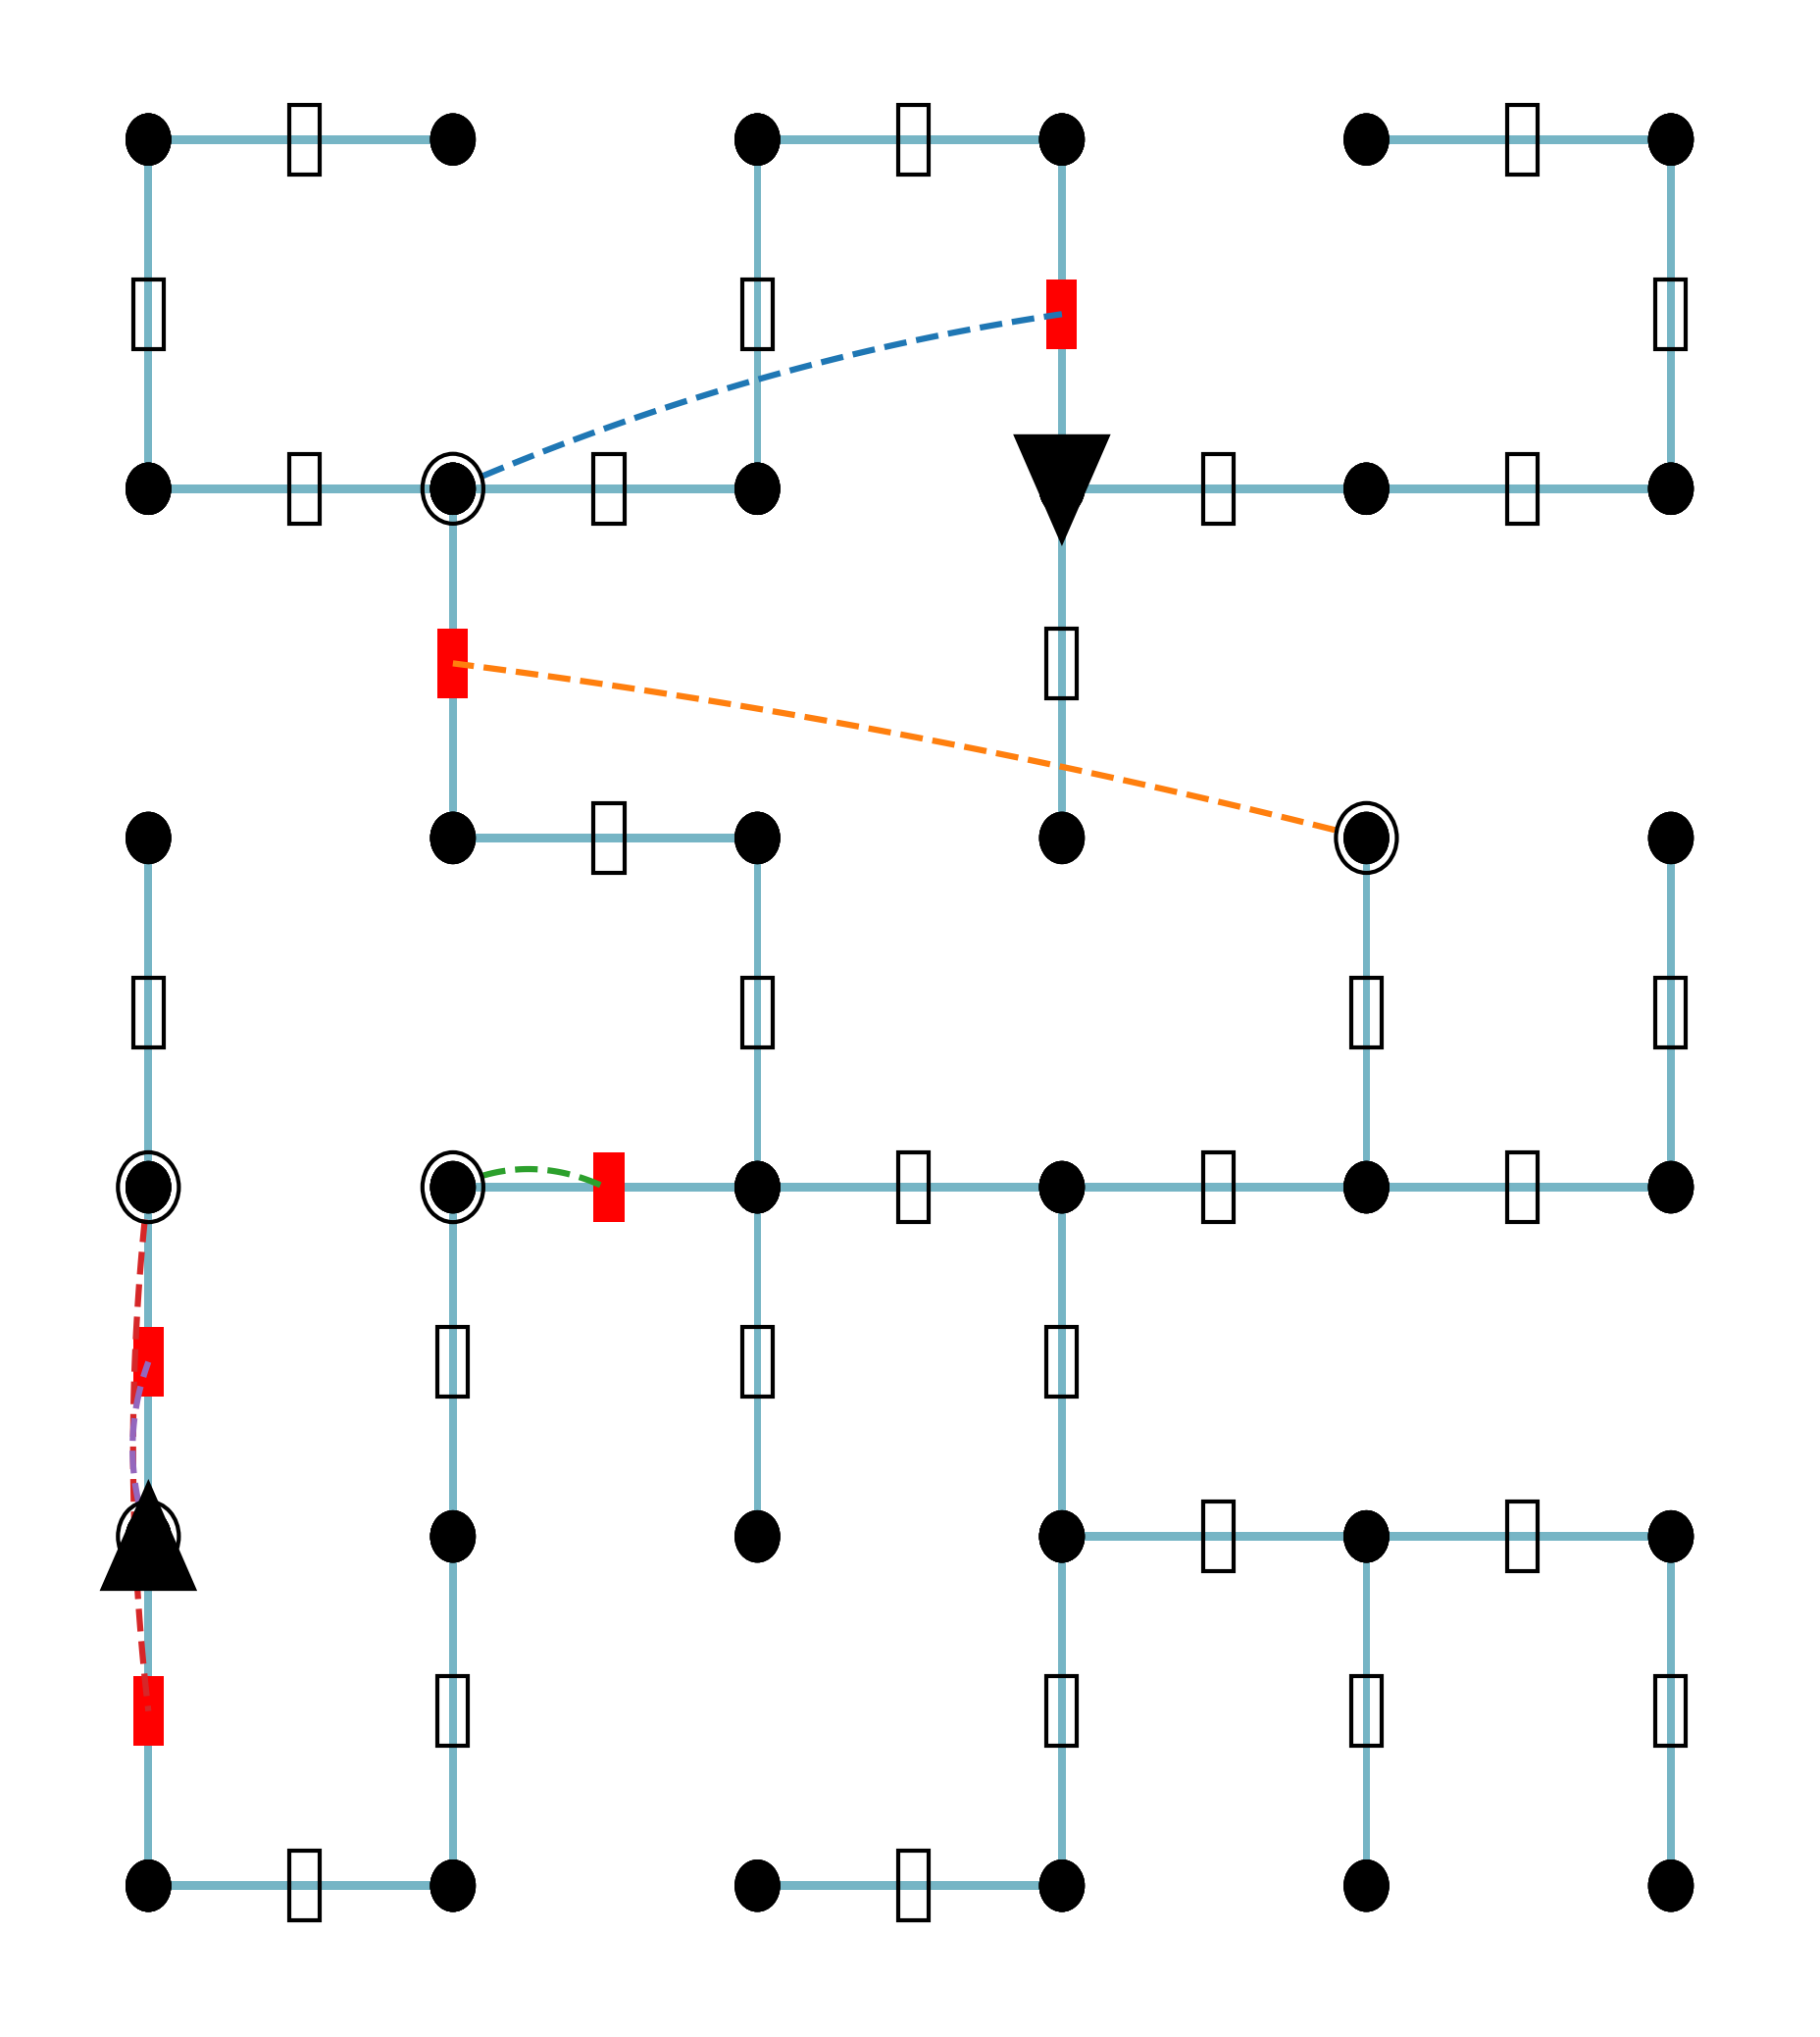
The image depicts a structured grid of interconnected nodes (black circles) arranged in a 5x5 matrix. Nodes are connected by blue lines with white rectangular markers at regular intervals. The diagram includes directional arrows (black triangles), colored rectangles (red, green), and dashed lines, suggesting a network flow or process with specific pathways and decision points.
### Components/Axes
- **Nodes**: Black circles positioned at grid intersections (coordinates implied by 5x5 layout).
- **Connections**:
- **Blue lines**: Primary pathways with white rectangular markers (possibly representing steps or stages).
- **Dashed lines**: Secondary or alternative routes (blue and red dashed lines).
- **Markers**:
- **Red rectangles**: Placed at specific nodes (e.g., (2,2), (3,3), (4,4)), likely indicating critical checkpoints or decision nodes.
- **Green dashed line**: Connects nodes (1,1) → (2,2) → (3,3), suggesting a highlighted path or priority route.
- **Arrows**: Black triangles pointing in cardinal directions (e.g., right, down, left), indicating flow directionality.
### Detailed Analysis
- **Grid Structure**:
- Nodes are evenly spaced, forming a 5x5 matrix. Each node connects to adjacent nodes horizontally/vertically.
- White rectangles on blue lines may represent discrete steps or milestones in a process.
- **Pathways**:
- **Primary Flow**: Most nodes follow a rightward or downward trajectory (e.g., arrows at (1,1) → (1,2), (2,1) → (3,1)).
- **Dashed Paths**:
- Blue dashed line connects (1,3) → (2,3) → (3,3), bypassing some nodes.
- Red dashed line links (4,1) → (4,2) → (4,3), indicating a lateral deviation.
- **Critical Nodes**: Red rectangles at (2,2), (3,3), and (4,4) suggest these nodes are pivotal for decision-making or resource allocation.
### Key Observations
1. **Directional Bias**: Most arrows point right or down, implying a default flow from top-left to bottom-right.
2. **Dashed Line Anomalies**:
- The green dashed line (1,1) → (2,2) → (3,3) deviates from the grid’s primary axis, possibly representing a shortcut or priority path.
- Red dashed lines at the bottom-left corner (4,1) → (4,2) → (4,3) suggest lateral movement after reaching a lower row.
3. **Red Rectangle Placement**: The diagonal alignment of red rectangles (2,2), (3,3), (4,4) may indicate a feedback loop or escalation path.
### Interpretation
This diagram likely represents a **process flow** or **network topology** with:
- **Primary Workflow**: A sequential path from top-left to bottom-right, with nodes acting as processing units.
- **Decision Points**: Red rectangles at (2,2), (3,3), (4,4) could represent branching logic (e.g., "if condition X, proceed to node Y").
- **Alternative Routes**: Dashed lines allow bypassing certain steps, suggesting flexibility or error-handling mechanisms.
- **Priority Path**: The green dashed line highlights a critical or expedited route, possibly for high-priority tasks.
The absence of textual labels limits precise interpretation, but the structured layout and directional cues strongly suggest a **systematic workflow** with modular components and conditional pathways. The red and green markers emphasize nodes or routes requiring special attention, such as bottlenecks or fast tracks.