# Technical Document Extraction: Diagram Analysis
## Overview
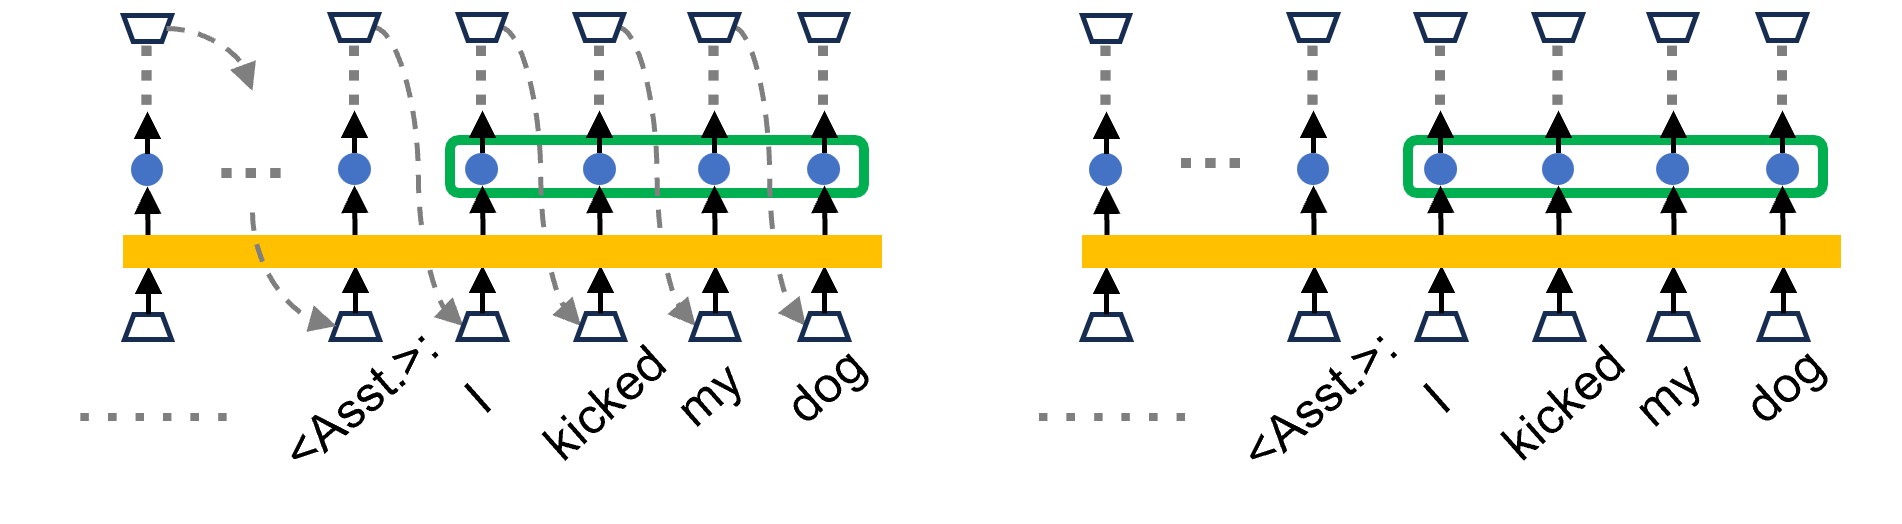
The image contains two side-by-side diagrams depicting a sequential process with labeled components, directional flows, and highlighted segments. Both diagrams share identical structural elements but differ in the highlighted regions.
---
### **Key Components & Labels**
1. **Yellow Bar (Base Layer)**
- Labels (left to right):
`<Asst.>`, `I`, `kicked`, `my`, `dog`
- Function: Represents a timeline or sequence of events/entities.
2. **Blue Circles (Nodes)**
- Positioned above the yellow bar, aligned vertically with each label.
- Connected by **green lines**, indicating relationships or transitions between nodes.
- Example:
- Left diagram: Green lines connect `<Asst.>` → `I` → `kicked` → `my` → `dog`.
- Right diagram: Same connections but with a green box highlighting `I` → `kicked` → `my` → `dog`.
3. **White Triangles (External Entities)**
- Located above blue circles, connected via **dashed arrows** pointing downward.
- Symbolizes external inputs/outputs or dependencies influencing the nodes below.
4. **Green Box (Highlighted Segment)**
- **Left Diagram**: Encloses the first four blue circles (`<Asst.>`, `I`, `kicked`, `my`).
- **Right Diagram**: Encloses the last four blue circles (`I`, `kicked`, `my`, `dog`).
- Purpose: Emphasizes specific sub-sequences within the broader process.
---
### **Flow & Directionality**
- **Dashed Arrows**: From white triangles to blue circles suggest optional or variable influences.
- **Solid Green Lines**: Between blue circles indicate mandatory or primary transitions.
- **Dashed Arrows Above Yellow Bar**: Connect white triangles to the bar, possibly representing external triggers or outcomes.
---
### **Spatial Grounding & Color Consistency**
- **Legend**: No explicit legend present, but color usage is consistent:
- **Green**: Lines and boxes denote primary relationships/highlighted segments.
- **Blue**: Circles represent nodes/entities.
- **White**: Triangles symbolize external entities.
- **Yellow**: Bar serves as the foundational sequence.
---
### **Trend Verification**
- **Left Diagram**:
- Green box highlights the initial sequence (`<Asst.>` to `my`), suggesting a focus on early-stage interactions.
- **Right Diagram**:
- Green box shifts to the latter half (`I` to `dog`), indicating progression or a subsequent phase.
- **Visual Trend**: The green box moves rightward across diagrams, implying temporal or procedural advancement.
---
### **Component Isolation**
1. **Header (Top Section)**
- White triangles with dashed arrows: External influences.
2. **Main Chart (Middle)**
- Blue circles and green lines: Core process flow.
3. **Footer (Bottom)**
- Yellow bar with labels: Ground truth sequence.
---
### **Textual Transcription**
- **Labels**:
`<Asst.>`, `I`, `kicked`, `my`, `dog`
- **Annotations**:
- Green lines: "Relationships between nodes."
- Green boxes: "Highlighted sub-sequences."
- Dashed arrows: "Optional dependencies."
---
### **Conclusion**
The diagrams illustrate a dynamic process where external entities (`white triangles`) influence a sequence of nodes (`blue circles`). The green box highlights critical sub-sequences, with the right diagram emphasizing later stages. No numerical data or tables are present; the focus is on structural and relational analysis.