TECHNICAL ASSET FINGERPRINT
3a89013f775a57388eab856d
Click to view fullscreen
Press ESC or click to close
FOUND IN PAPERS
EXPERT: healer-alpha-free VERSION 1
RUNTIME: free/openrouter/healer-alpha
INTEL_VERIFIED
## Heatmap Table: AI Model Performance Across Error Categories
### Overview
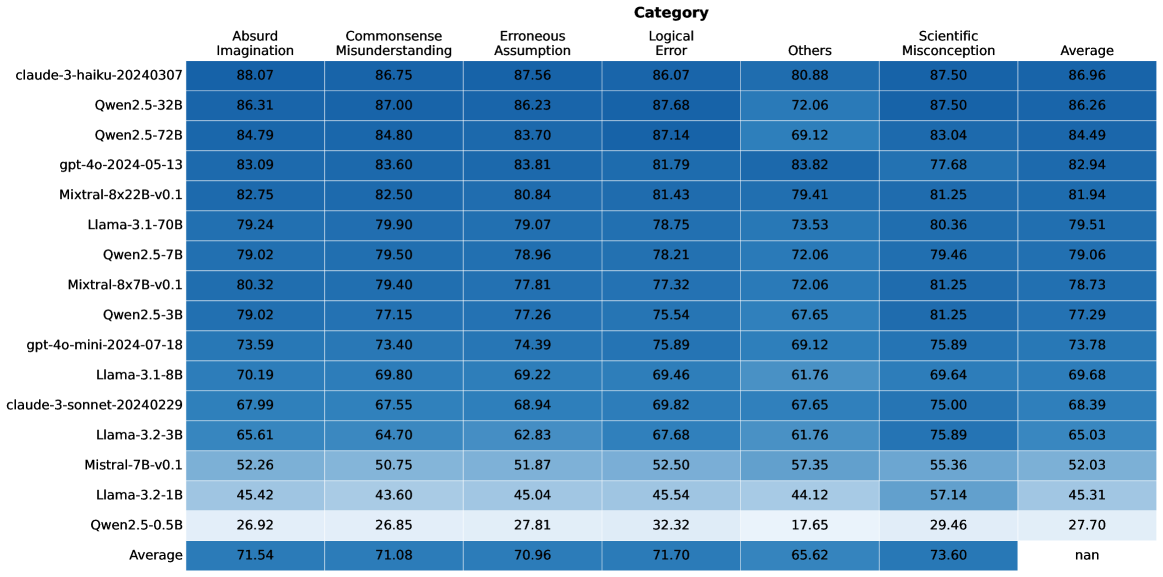
The image displays a heatmap-style table comparing the performance of 16 different large language models (LLMs) across six specific error categories and an overall average. The data is presented as numerical scores, likely percentages, where higher values indicate better performance (fewer errors). The table is sorted in descending order based on the "Average" score.
### Components/Axes
* **Title:** "Category" (centered at the top).
* **Rows (Y-axis):** List of 16 AI model identifiers. From top to bottom:
1. claude-3-haiku-20240307
2. Qwen2.5-32B
3. Qwen2.5-72B
4. gpt-4o-2024-05-13
5. Mixtral-8x22B-v0.1
6. Llama-3.1-70B
7. Qwen2.5-7B
8. Mixtral-8x7B-v0.1
9. Qwen2.5-3B
10. gpt-4o-mini-2024-07-18
11. Llama-3.1-8B
12. claude-3-sonnet-20240229
13. Llama-3.2-3B
14. Mistral-7B-v0.1
15. Llama-3.2-1B
16. Qwen2.5-0.5B
* **Columns (X-axis):** Seven categories. From left to right:
1. Absurd Imagination
2. Commonsense Misunderstanding
3. Erroneous Assumption
4. Logical Error
5. Others
6. Scientific Misconception
7. Average
* **Data Cells:** Contain numerical scores (to two decimal places) for each model-category pair. The background color of each cell follows a gradient from dark blue (higher score) to light blue (lower score), providing a visual heatmap.
* **Footer Row:** Labeled "Average" at the bottom-left, containing the column-wise average score for each category. The cell under the "Average" column contains "nan" (not a number).
### Detailed Analysis
**Data Extraction (Model, Category: Score):**
* **claude-3-haiku-20240307:** Absurd Imagination: 88.07, Commonsense Misunderstanding: 86.75, Erroneous Assumption: 87.56, Logical Error: 86.07, Others: 80.88, Scientific Misconception: 87.50, **Average: 86.96**
* **Qwen2.5-32B:** Absurd Imagination: 86.31, Commonsense Misunderstanding: 87.00, Erroneous Assumption: 86.23, Logical Error: 87.68, Others: 72.06, Scientific Misconception: 87.50, **Average: 86.26**
* **Qwen2.5-72B:** Absurd Imagination: 84.79, Commonsense Misunderstanding: 84.80, Erroneous Assumption: 83.70, Logical Error: 87.14, Others: 69.12, Scientific Misconception: 83.04, **Average: 84.49**
* **gpt-4o-2024-05-13:** Absurd Imagination: 83.09, Commonsense Misunderstanding: 83.60, Erroneous Assumption: 83.81, Logical Error: 81.79, Others: 83.82, Scientific Misconception: 77.68, **Average: 82.94**
* **Mixtral-8x22B-v0.1:** Absurd Imagination: 82.75, Commonsense Misunderstanding: 82.50, Erroneous Assumption: 80.84, Logical Error: 81.43, Others: 79.41, Scientific Misconception: 81.25, **Average: 81.94**
* **Llama-3.1-70B:** Absurd Imagination: 79.24, Commonsense Misunderstanding: 79.90, Erroneous Assumption: 79.07, Logical Error: 78.75, Others: 73.53, Scientific Misconception: 80.36, **Average: 79.51**
* **Qwen2.5-7B:** Absurd Imagination: 79.02, Commonsense Misunderstanding: 79.50, Erroneous Assumption: 78.96, Logical Error: 78.21, Others: 72.06, Scientific Misconception: 79.46, **Average: 79.06**
* **Mixtral-8x7B-v0.1:** Absurd Imagination: 80.32, Commonsense Misunderstanding: 79.40, Erroneous Assumption: 77.81, Logical Error: 77.32, Others: 72.06, Scientific Misconception: 81.25, **Average: 78.73**
* **Qwen2.5-3B:** Absurd Imagination: 79.02, Commonsense Misunderstanding: 77.15, Erroneous Assumption: 77.26, Logical Error: 75.54, Others: 67.65, Scientific Misconception: 81.25, **Average: 77.29**
* **gpt-4o-mini-2024-07-18:** Absurd Imagination: 73.59, Commonsense Misunderstanding: 73.40, Erroneous Assumption: 74.39, Logical Error: 75.89, Others: 69.12, Scientific Misconception: 75.89, **Average: 73.78**
* **Llama-3.1-8B:** Absurd Imagination: 70.19, Commonsense Misunderstanding: 69.80, Erroneous Assumption: 69.22, Logical Error: 69.46, Others: 61.76, Scientific Misconception: 69.64, **Average: 69.68**
* **claude-3-sonnet-20240229:** Absurd Imagination: 67.99, Commonsense Misunderstanding: 67.55, Erroneous Assumption: 68.94, Logical Error: 69.82, Others: 67.65, Scientific Misconception: 75.00, **Average: 68.39**
* **Llama-3.2-3B:** Absurd Imagination: 65.61, Commonsense Misunderstanding: 64.70, Erroneous Assumption: 62.83, Logical Error: 67.68, Others: 61.76, Scientific Misconception: 75.89, **Average: 65.03**
* **Mistral-7B-v0.1:** Absurd Imagination: 52.26, Commonsense Misunderstanding: 50.75, Erroneous Assumption: 51.87, Logical Error: 52.50, Others: 57.35, Scientific Misconception: 55.36, **Average: 52.03**
* **Llama-3.2-1B:** Absurd Imagination: 45.42, Commonsense Misunderstanding: 43.60, Erroneous Assumption: 45.04, Logical Error: 45.54, Others: 44.12, Scientific Misconception: 57.14, **Average: 45.31**
* **Qwen2.5-0.5B:** Absurd Imagination: 26.92, Commonsense Misunderstanding: 26.85, Erroneous Assumption: 27.81, Logical Error: 32.32, Others: 17.65, Scientific Misconception: 29.46, **Average: 27.70**
**Column Averages (Bottom Row):**
* Absurd Imagination: 71.54
* Commonsense Misunderstanding: 71.08
* Erroneous Assumption: 70.96
* Logical Error: 71.70
* Others: 65.62
* Scientific Misconception: 73.60
* Average: nan
### Key Observations
1. **Performance Hierarchy:** There is a clear performance stratification. The top three models (claude-3-haiku, Qwen2.5-32B, Qwen2.5-72B) all have averages above 84. The bottom three (Mistral-7B, Llama-3.2-1B, Qwen2.5-0.5B) have averages below 53.
2. **Category Difficulty:** The "Others" category has the lowest average score (65.62), suggesting it may contain more challenging or diverse error types. "Scientific Misconception" has the highest average (73.60), indicating models may be relatively better at this task.
3. **Model-Specific Trends:**
* **claude-3-haiku-20240307** is the top performer, leading in 5 of 6 individual categories.
* **Qwen2.5-0.5B** is the lowest performer, with a particularly low score in "Others" (17.65).
* **gpt-4o-2024-05-13** shows a notable strength in the "Others" category (83.82), which is its highest score and significantly above the column average.
* **Llama-3.2-3B** and **Llama-3.2-1B** show a relative strength in "Scientific Misconception" compared to their other scores.
4. **Consistency:** Most models show relatively consistent performance across the first four categories (Absurd Imagination, Commonsense Misunderstanding, Erroneous Assumption, Logical Error), with scores often within a 2-5 point range for a given model. The "Others" and "Scientific Misconception" categories show more variance.
### Interpretation
This heatmap provides a comparative benchmark of LLMs on specific reasoning and knowledge tasks. The data suggests that model scale (e.g., Qwen2.5-0.5B vs. 72B) is a strong predictor of performance, but architecture and training also play significant roles, as seen with the top-performing claude-3-haiku model.
The "Others" category acts as a catch-all and appears to be the most discriminative, separating models more sharply than the defined categories. This could imply that the defined error types (Absurd Imagination, etc.) are somewhat easier for current models to handle, while the undefined errors in "Others" represent a greater challenge.
The high average in "Scientific Misconception" might indicate that factual scientific knowledge is a well-represented and learned component in these models' training data. Conversely, the lower scores in "Others" and the defined reasoning categories highlight ongoing challenges in robust, generalizable reasoning and handling edge cases.
The "nan" in the bottom-right cell is a minor data artifact, indicating the average of the "Average" column was not computed or is not applicable. The overall visualization effectively communicates that while top-tier models perform strongly across the board, there remains a wide performance gap between the largest/most advanced models and smaller ones, and consistent performance across all types of reasoning errors is still an area for development.
DECODING INTELLIGENCE...