## Table: Model Performance Across Evaluation Categories
### Overview
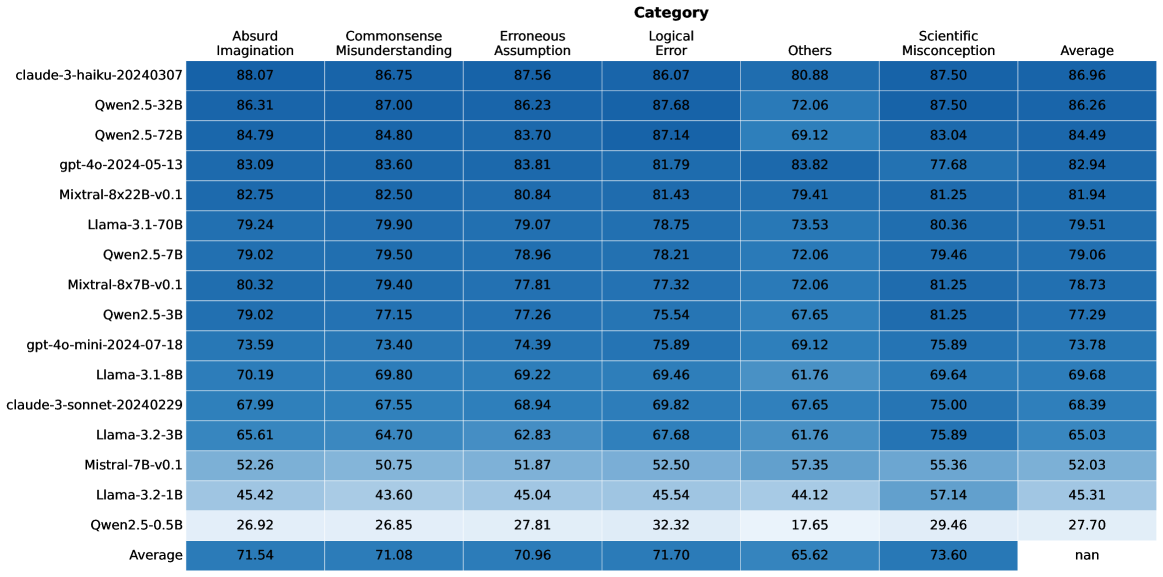
The table presents a comparative analysis of multiple AI models across seven evaluation categories, including their average performance. Each row represents a distinct model configuration, with numerical scores indicating performance metrics. The final row summarizes average performance across all models.
### Components/Axes
- **Rows**: Model identifiers (e.g., "claud-3-haiku-20240307", "Qwen2.5-32B", "gpt-4o-2024-05-13")
- **Columns**:
1. Absurd Imagination
2. Commonsense Misunderstanding
3. Erroneous Assumption
4. Logical Error
5. Others
6. Scientific Misconception
7. Average
- **Legend**: Categories mapped to colors (e.g., "Absurd Imagination" = dark blue, "Commonsense Misunderstanding" = medium blue, etc.)
- **Spatial Layout**:
- Legend positioned at the top
- Data table occupies the majority of the space
- Average row at the bottom
### Detailed Analysis
| Model Identifier | Absurd Imagination | Commonsense Misunderstanding | Erroneous Assumption | Logical Error | Others | Scientific Misconception | Average |
|---------------------------|--------------------|------------------------------|----------------------|---------------|--------|--------------------------|---------|
| claud-3-haiku-20240307 | 88.07 | 86.75 | 87.56 | 86.07 | 80.88 | 87.50 | 86.96 |
| Qwen2.5-32B | 86.31 | 87.00 | 86.23 | 87.68 | 72.06 | 87.50 | 86.26 |
| Qwen2.5-72B | 84.79 | 84.80 | 83.70 | 87.14 | 69.12 | 83.04 | 84.49 |
| gpt-4o-2024-05-13 | 83.09 | 83.60 | 83.81 | 81.79 | 83.82 | 77.68 | 82.94 |
| Mixtral-8x22B-v0.1 | 82.75 | 82.50 | 80.84 | 81.43 | 79.41 | 81.25 | 81.94 |
| Llama-3-1-70B | 79.24 | 79.90 | 79.07 | 78.75 | 73.53 | 80.36 | 79.51 |
| Qwen2.5-7B | 79.02 | 79.50 | 78.96 | 78.21 | 72.06 | 79.46 | 79.06 |
| Mixtral-8x7B-v0.1 | 80.32 | 79.40 | 77.81 | 77.32 | 72.06 | 81.25 | 78.73 |
| Qwen2.5-3B | 79.02 | 77.15 | 77.26 | 75.54 | 67.65 | 81.25 | 77.29 |
| gpt-4o-mini-2024-07-18 | 73.59 | 73.40 | 74.39 | 75.89 | 69.12 | 75.89 | 73.78 |
| Llama-3-1-8B | 70.19 | 69.80 | 69.22 | 69.46 | 61.76 | 69.64 | 69.68 |
| claud-3-sonnet-20240229 | 67.99 | 67.55 | 68.94 | 69.82 | 67.65 | 75.00 | 68.39 |
| Llama-3-2-3B | 65.61 | 64.70 | 62.83 | 67.68 | 61.76 | 75.89 | 65.03 |
| Mixtral-7B-v0.1 | 52.26 | 50.75 | 51.87 | 52.50 | 57.35 | 55.36 | 52.03 |
| Llama-3-2-1B | 45.42 | 43.60 | 45.04 | 45.54 | 44.12 | 57.14 | 45.31 |
| Qwen2.5-0.5B | 26.92 | 26.85 | 27.81 | 32.32 | 17.65 | 29.46 | 27.70 |
| **Average** | 71.54 | 71.08 | 70.96 | 71.70 | 65.62 | 73.60 | nan |
### Key Observations
1. **Highest Performers**:
- `claud-3-haiku-20240307` leads in most categories, with scores above 86 in all except "Others" (80.88).
- `Qwen2.5-32B` and `Qwen2.5-72B` show strong performance in "Erroneous Assumption" (86.23, 83.70) and "Logical Error" (87.68, 87.14).
2. **Lowest Performers**:
- `Qwen2.5-0.5B` scores poorly across all categories, with the lowest average (27.70).
- `Mixtral-7B-v0.1` and `Llama-3-2-1B` underperform in "Absurd Imagination" (52.26, 45.42) and "Commonsense Misunderstanding" (50.75, 43.60).
3. **Category Trends**:
- "Erroneous Assumption" and "Logical Error" categories generally have higher scores (70.96–87.68) compared to "Others" (65.62) and "Scientific Misconception" (73.60).
- "Others" category shows significant variability, with scores ranging from 17.65 (Qwen2.5-0.5B) to 83.82 (gpt-4o-2024-05-13).
4. **Average Performance**:
- The overall average (71.54) is highest for "Absurd Imagination" and lowest for "Others" (65.62).
- "Scientific Misconception" average (73.60) suggests moderate consistency across models.
### Interpretation
- **Model Specialization**: High-performing models like `claud-3-haiku-20240307` demonstrate robustness across diverse evaluation criteria, suggesting advanced reasoning capabilities.
- **Weaknesses in "Others"**: The lower average for the "Others" category (65.62) indicates this metric may represent edge cases or less common scenarios where models struggle.
- **Scale Correlation**: Larger models (e.g., Mixtral-8x22B-v0.1, Llama-3-1-70B) generally outperform smaller variants (e.g., Qwen2.5-0.5B), though exceptions exist (e.g., Mixtral-7B-v0.1 underperforms despite larger size).
- **Data Gaps**: The "nan" value in the final "Average" column suggests missing data for the last category, requiring further investigation.
This analysis highlights trade-offs between model size, architecture, and performance across evaluation domains, with implications for selecting models based on specific use cases.