## Bar Charts: Performance Metrics Comparison
### Overview
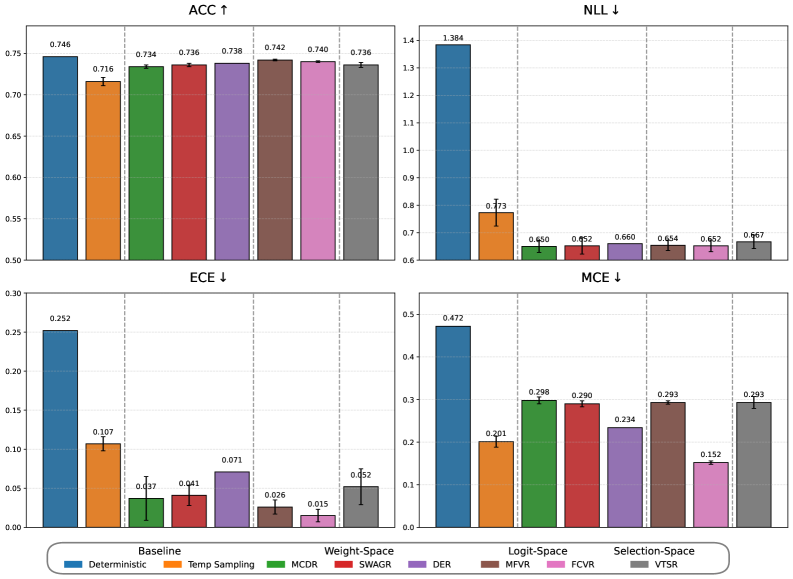
The image presents four bar charts comparing the performance of different methods across four metrics: ACC (Accuracy), NLL (Negative Log-Likelihood), ECE (Expected Calibration Error), and MCE (Maximum Calibration Error). Each chart compares a baseline "Deterministic" method against several other methods grouped into "Weight-Space", "Logit-Space", and "Selection-Space" categories. Error bars are included on each bar.
### Components/Axes
**General Chart Elements:**
* Each chart has a vertical y-axis representing the metric value and a horizontal axis representing the different methods.
* Each method is represented by a colored bar, with the color corresponding to the method as defined in the legend at the bottom.
* Error bars are present on each bar, indicating the uncertainty or variance in the metric value.
* Horizontal gridlines are present in each chart.
**Legend (Bottom):**
* **Deterministic** (Blue) - Baseline
* **Temp Sampling** (Orange) - Baseline
* **MCDR** (Green) - Weight-Space
* **SWAGR** (Red) - Weight-Space
* **DER** (Purple) - Weight-Space
* **MFVR** (Brown) - Logit-Space
* **FCVR** (Pink) - Logit-Space
* **VTSR** (Gray) - Selection-Space
**Chart 1: ACC ↑ (Top-Left)**
* Title: ACC ↑ (Accuracy, higher is better)
* Y-axis: Ranges from 0.50 to 0.75
* Methods: Deterministic, Temp Sampling, MCDR, SWAGR, DER, MFVR, FCVR, VTSR
* Categories: Baseline, Weight-Space, Logit-Space, Selection-Space
**Chart 2: NLL ↓ (Top-Right)**
* Title: NLL ↓ (Negative Log-Likelihood, lower is better)
* Y-axis: Ranges from 0.6 to 1.4
* Methods: Deterministic, Temp Sampling, MCDR, SWAGR, DER, MFVR, FCVR, VTSR
* Categories: Baseline, Weight-Space, Logit-Space, Selection-Space
**Chart 3: ECE ↓ (Bottom-Left)**
* Title: ECE ↓ (Expected Calibration Error, lower is better)
* Y-axis: Ranges from 0.00 to 0.30
* Methods: Deterministic, Temp Sampling, MCDR, SWAGR, DER, MFVR, FCVR, VTSR
* Categories: Baseline, Weight-Space, Logit-Space, Selection-Space
**Chart 4: MCE ↓ (Bottom-Right)**
* Title: MCE ↓ (Maximum Calibration Error, lower is better)
* Y-axis: Ranges from 0.0 to 0.5
* Methods: Deterministic, Temp Sampling, MCDR, SWAGR, DER, MFVR, FCVR, VTSR
* Categories: Baseline, Weight-Space, Logit-Space, Selection-Space
### Detailed Analysis
**Chart 1: ACC ↑**
* **Deterministic (Blue):** 0.746
* **Temp Sampling (Orange):** 0.716
* **MCDR (Green):** 0.734
* **SWAGR (Red):** 0.736
* **DER (Purple):** 0.738
* **MFVR (Brown):** 0.742
* **FCVR (Pink):** 0.740
* **VTSR (Gray):** 0.736
* Trend: All methods perform relatively similarly, with Deterministic and MFVR showing slightly higher accuracy.
**Chart 2: NLL ↓**
* **Deterministic (Blue):** 1.384
* **Temp Sampling (Orange):** 0.773
* **MCDR (Green):** 0.650
* **SWAGR (Red):** 0.652
* **DER (Purple):** 0.660
* **MFVR (Brown):** 0.654
* **FCVR (Pink):** 0.652
* **VTSR (Gray):** 0.667
* Trend: Deterministic has a significantly higher NLL compared to other methods. The other methods are clustered together with similar, lower NLL values.
**Chart 3: ECE ↓**
* **Deterministic (Blue):** 0.252
* **Temp Sampling (Orange):** 0.107
* **MCDR (Green):** 0.037
* **SWAGR (Red):** 0.041
* **DER (Purple):** 0.071
* **MFVR (Brown):** 0.026
* **FCVR (Pink):** 0.015
* **VTSR (Gray):** 0.052
* Trend: Deterministic has a much higher ECE than the other methods. FCVR has the lowest ECE.
**Chart 4: MCE ↓**
* **Deterministic (Blue):** 0.472
* **Temp Sampling (Orange):** 0.201
* **MCDR (Green):** 0.298
* **SWAGR (Red):** 0.290
* **DER (Purple):** 0.234
* **MFVR (Brown):** 0.293
* **FCVR (Pink):** 0.152
* **VTSR (Gray):** 0.293
* Trend: Deterministic has a significantly higher MCE. FCVR has the lowest MCE.
### Key Observations
* The "Deterministic" baseline method consistently performs worse in terms of NLL, ECE, and MCE compared to the other methods.
* In terms of accuracy (ACC), the methods are relatively similar, with "Deterministic" and "MFVR" showing slightly higher values.
* Methods in the "Weight-Space", "Logit-Space", and "Selection-Space" categories generally improve upon the baseline in terms of calibration (ECE and MCE) and likelihood (NLL).
* FCVR (Pink) appears to have the lowest ECE and MCE.
### Interpretation
The data suggests that using techniques from "Weight-Space", "Logit-Space", and "Selection-Space" can significantly improve the calibration and likelihood of a model compared to a standard "Deterministic" approach. While accuracy is relatively similar across all methods, the improvements in NLL, ECE, and MCE indicate that these techniques lead to more reliable and well-calibrated predictions. The "Deterministic" method, while achieving comparable accuracy, is less confident and less well-calibrated, as evidenced by its higher NLL, ECE, and MCE values. FCVR appears to be the best performing method in terms of calibration error.