## Bar Charts: Model Performance Metrics Comparison
### Overview
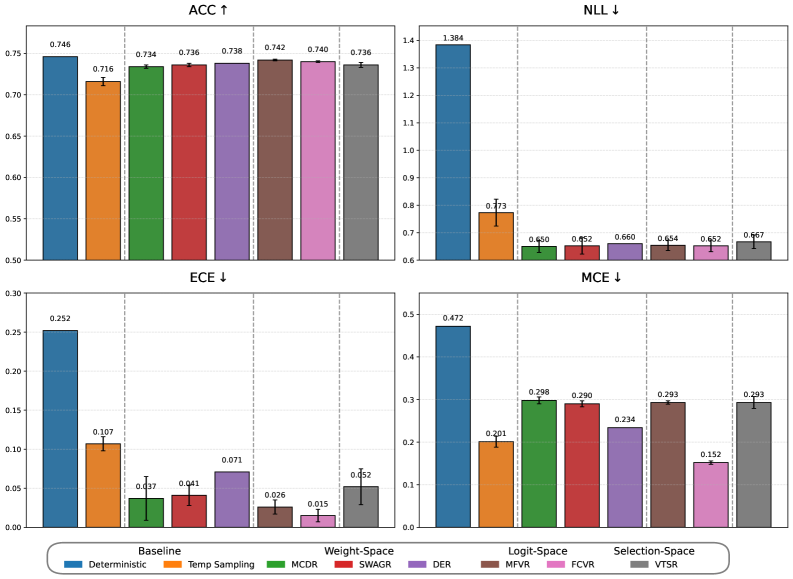
The image displays a 2x2 grid of four bar charts comparing the performance of eight different machine learning methods across four evaluation metrics. The charts are titled **ACC** (Accuracy), **NLL** (Negative Log-Likelihood), **ECE** (Expected Calibration Error), and **MCE** (Maximum Calibration Error). Arrows next to the titles indicate the desired direction for each metric: an upward arrow (↑) for ACC means higher values are better, while downward arrows (↓) for NLL, ECE, and MCE mean lower values are better.
### Components/Axes
* **Chart Layout:** Four separate bar charts arranged in a 2x2 grid.
* **Titles:**
* Top-Left: `ACC ↑`
* Top-Right: `NLL ↓`
* Bottom-Left: `ECE ↓`
* Bottom-Right: `MCE ↓`
* **Y-Axes:** Each chart has a numerical y-axis with scales appropriate to the metric's range.
* **X-Axes:** Each chart shares the same categorical x-axis structure, divided into four main groups:
1. `Baseline`
2. `Weight-Space`
3. `Logit-Space`
4. `Selection-Space`
* **Legend:** A single, horizontal legend is positioned at the bottom center of the entire figure. It maps colors to method names:
* Blue: `Deterministic`
* Orange: `Temp Sampling`
* Green: `MCDR`
* Red: `SWAGR`
* Purple: `DER`
* Brown: `MFVR`
* Pink: `FCVR`
* Gray: `VTSR`
* **Data Representation:** Each bar represents the performance of a specific method within a specific category. The exact numerical value is printed above each bar. Error bars are present on all bars.
### Detailed Analysis
**1. ACC (Accuracy) Chart (Top-Left)**
* **Trend:** All methods achieve relatively high accuracy, clustered between approximately 0.71 and 0.75. The `Deterministic` baseline has the highest value.
* **Data Points (from left to right):**
* **Baseline:** Deterministic (Blue): `0.746`
* **Weight-Space:** Temp Sampling (Orange): `0.716`, MCDR (Green): `0.734`, SWAGR (Red): `0.736`, DER (Purple): `0.738`
* **Logit-Space:** MFVR (Brown): `0.742`, FCVR (Pink): `0.740`
* **Selection-Space:** VTSR (Gray): `0.736`
**2. NLL (Negative Log-Likelihood) Chart (Top-Right)**
* **Trend:** The `Deterministic` baseline has a dramatically higher (worse) NLL than all other methods. The remaining methods are clustered between ~0.65 and 0.77.
* **Data Points (from left to right):**
* **Baseline:** Deterministic (Blue): `1.384`
* **Weight-Space:** Temp Sampling (Orange): `0.773`, MCDR (Green): `0.650`, SWAGR (Red): `0.652`, DER (Purple): `0.660`
* **Logit-Space:** MFVR (Brown): `0.654`, FCVR (Pink): `0.652`
* **Selection-Space:** VTSR (Gray): `0.667`
**3. ECE (Expected Calibration Error) Chart (Bottom-Left)**
* **Trend:** The `Deterministic` baseline has the highest (worst) calibration error. Most other methods show significantly lower ECE, with `FCVR` achieving the lowest value.
* **Data Points (from left to right):**
* **Baseline:** Deterministic (Blue): `0.252`
* **Weight-Space:** Temp Sampling (Orange): `0.107`, MCDR (Green): `0.037`, SWAGR (Red): `0.041`, DER (Purple): `0.071`
* **Logit-Space:** MFVR (Brown): `0.026`, FCVR (Pink): `0.015`
* **Selection-Space:** VTSR (Gray): `0.052`
**4. MCE (Maximum Calibration Error) Chart (Bottom-Right)**
* **Trend:** Similar to ECE, the `Deterministic` baseline has the highest (worst) maximum calibration error. `FCVR` again shows the best (lowest) performance.
* **Data Points (from left to right):**
* **Baseline:** Deterministic (Blue): `0.472`
* **Weight-Space:** Temp Sampling (Orange): `0.201`, MCDR (Green): `0.298`, SWAGR (Red): `0.290`, DER (Purple): `0.234`
* **Logit-Space:** MFVR (Brown): `0.293`, FCVR (Pink): `0.152`
* **Selection-Space:** VTSR (Gray): `0.293`
### Key Observations
1. **Accuracy vs. Calibration Trade-off:** The `Deterministic` baseline achieves the highest raw accuracy (`ACC=0.746`) but performs worst on all calibration and uncertainty metrics (NLL, ECE, MCE). This is a classic indicator of an overconfident model.
2. **Superior Calibration of Advanced Methods:** All other methods (Temp Sampling, MCDR, SWAGR, DER, MFVR, FCVR, VTSR) show dramatically better (lower) NLL, ECE, and MCE values compared to the baseline, often by a factor of 2-10x, while sacrificing only a small amount of accuracy (typically 1-3 percentage points).
3. **Top Performer for Calibration:** The `FCVR` method (pink bar, Logit-Space category) achieves the best scores on both calibration error metrics (`ECE=0.015`, `MCE=0.152`) and is among the best on NLL (`0.652`), with a competitive accuracy of `0.740`.
4. **Consistency Across Categories:** Methods within the `Weight-Space`, `Logit-Space`, and `Selection-Space` categories generally outperform the `Baseline` on uncertainty metrics. The `Logit-Space` methods (MFVR, FCVR) show particularly strong and consistent calibration performance.
### Interpretation
This set of charts provides a comprehensive evaluation of model performance beyond simple accuracy. The data strongly suggests that while a standard deterministic model (`Deterministic`) can achieve high accuracy, it is poorly calibrated—its confidence scores do not align well with its actual correctness. This is a critical flaw for applications requiring reliable uncertainty estimates, such as medical diagnosis or autonomous systems.
The other seven methods represent techniques for improving model calibration and uncertainty quantification. The charts demonstrate their effectiveness: they successfully reduce calibration error (ECE, MCE) and improve probabilistic predictions (lower NLL) with only a minor trade-off in accuracy. The `FCVR` method appears to offer the best balance, providing top-tier calibration with minimal accuracy loss. The visualization effectively argues for the adoption of such advanced methods when model reliability and uncertainty awareness are important, not just raw predictive power.