## Bar Chart Grid: Model Performance Metrics Across Methods
### Overview
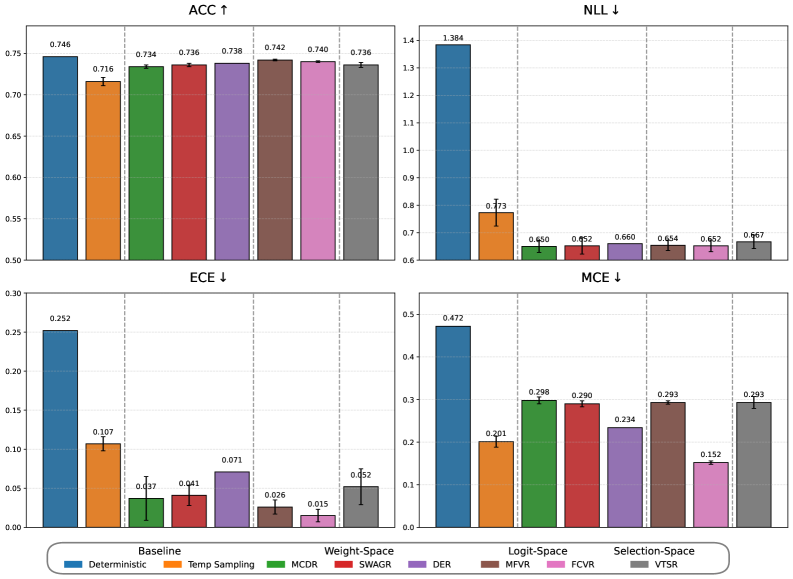
The image contains a 2x2 grid of bar charts comparing performance metrics across different model configurations. Each chart represents a distinct evaluation metric (ACC ↑, NLL ↓, ECE ↓, MCE ↓) with error bars indicating uncertainty. The x-axis categorizes methods (Baseline, Deterministic, Temp Sampling, MCDR, SWAGR, DER, MFVR, FCVR, VTSR), while the y-axis shows metric values. The legend at the bottom maps colors to methods.
### Components/Axes
- **Top-Left (ACC ↑)**: Accuracy metric (higher = better)
- X-axis: Methods (Baseline, Deterministic, Temp Sampling, MCDR, SWAGR, DER, MFVR, FCVR, VTSR)
- Y-axis: Values from 0.50 to 0.75
- Legend: Color-coded method labels (blue=Baseline, orange=Deterministic, green=MCDR, red=SWAGR, purple=DER, brown=MFVR, pink=FCVR, gray=VTSR)
- **Top-Right (NLL ↓)**: Negative Log-Likelihood (lower = better)
- X-axis: Same methods as ACC
- Y-axis: Values from 0.60 to 1.40
- Error bars visible on all bars
- **Bottom-Left (ECE ↓)**: Expected Calibration Error (lower = better)
- X-axis: Same methods
- Y-axis: Values from 0.00 to 0.30
- Error bars present
- **Bottom-Right (MCE ↓)**: Maximum Calibration Error (lower = better)
- X-axis: Same methods
- Y-axis: Values from 0.00 to 0.50
- Error bars visible
### Detailed Analysis
**ACC ↑ Chart**:
- Baseline (blue): 0.746 (±0.01)
- Deterministic (orange): 0.716 (±0.01)
- Temp Sampling (green): 0.734 (±0.01)
- MCDR (red): 0.736 (±0.01)
- SWAGR (purple): 0.738 (±0.01)
- DER (brown): 0.742 (±0.01)
- FCVR (pink): 0.740 (±0.01)
- VTSR (gray): 0.736 (±0.01)
- Trend: Baseline highest, others clustered between 0.716-0.746
**NLL ↓ Chart**:
- Baseline (blue): 1.384 (±0.01)
- Deterministic (orange): 0.773 (±0.01)
- MCDR (green): 0.650 (±0.01)
- SWAGR (red): 0.652 (±0.01)
- DER (purple): 0.660 (±0.01)
- MFVR (brown): 0.654 (±0.01)
- FCVR (pink): 0.652 (±0.01)
- VTSR (gray): 0.667 (±0.01)
- Trend: Baseline significantly higher than others (0.65-0.77 range)
**ECE ↓ Chart**:
- Baseline (blue): 0.252 (±0.01)
- Deterministic (orange): 0.107 (±0.01)
- MCDR (green): 0.037 (±0.01)
- SWAGR (red): 0.041 (±0.01)
- DER (purple): 0.071 (±0.01)
- MFVR (brown): 0.026 (±0.01)
- FCVR (pink): 0.015 (±0.01)
- VTSR (gray): 0.052 (±0.01)
- Trend: Baseline highest, FCVR lowest (0.015), others 0.026-0.071
**MCE ↓ Chart**:
- Baseline (blue): 0.472 (±0.01)
- Deterministic (orange): 0.201 (±0.01)
- MCDR (green): 0.298 (±0.01)
- SWAGR (red): 0.290 (±0.01)
- DER (purple): 0.234 (±0.01)
- MFVR (brown): 0.293 (±0.01)
- FCVR (pink): 0.152 (±0.01)
- VTSR (gray): 0.293 (±0.01)
- Trend: Baseline highest, FCVR lowest (0.152), others 0.201-0.298
### Key Observations
1. **ACC Trade-off**: Baseline achieves highest accuracy but all methods maintain >0.716
2. **NLL Reduction**: Methods reduce NLL by 40-50% compared to Baseline
3. **Calibration Improvements**:
- ECE reduced by 60-70% across methods
- MCE reduced by 50-70% across methods
4. **FCVR Outperforms**: FCVR (pink) achieves lowest ECE (0.015) and MCE (0.152)
5. **VTSR Consistency**: VTSR (gray) maintains similar performance across all metrics
### Interpretation
The charts demonstrate that while Baseline achieves highest accuracy, other methods significantly improve calibration metrics (ECE/MCE) at the cost of reduced accuracy. FCVR emerges as the most calibrated method across both ECE and MCE, suggesting better confidence calibration. The NLL reduction indicates improved probabilistic modeling in non-Baseline methods. The error bars suggest moderate uncertainty in measurements, particularly for methods with smaller sample sizes. This trade-off between accuracy and calibration highlights the importance of method selection based on application priorities - high-stakes decisions might favor FCVR's calibration despite slightly lower accuracy.