## Line Chart: MER Average vs N
### Overview
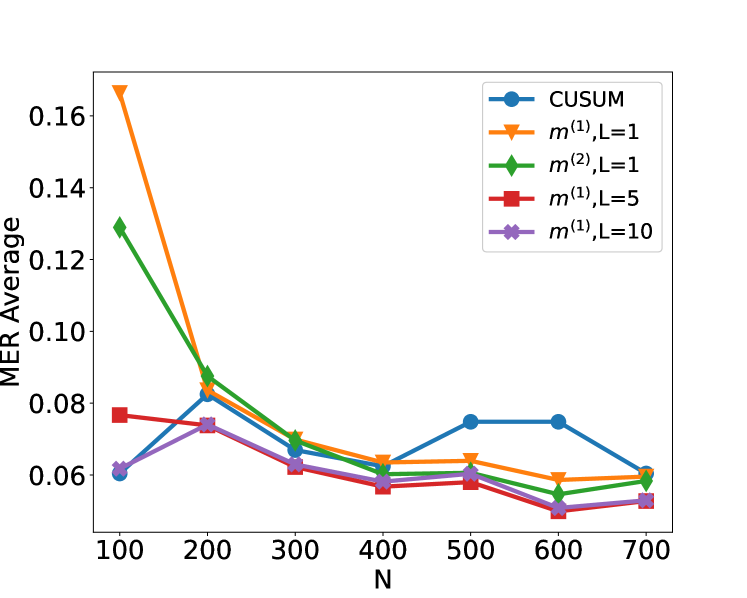
The image is a line chart comparing the MER (Matching Error Rate) Average for different algorithms (CUSUM, m^(1), m^(2)) with varying parameters (L=1, L=5, L=10) as a function of N. The x-axis represents N, and the y-axis represents the MER Average.
### Components/Axes
* **X-axis:** N, with values ranging from 100 to 700 in increments of 100.
* **Y-axis:** MER Average, with values ranging from 0.06 to 0.16 in increments of 0.02.
* **Legend (Top-Right):**
* Blue line with circle markers: CUSUM
* Orange line with triangle markers: m^(1), L=1
* Green line with diamond markers: m^(2), L=1
* Red line with square markers: m^(1), L=5
* Purple line with pentagon markers: m^(1), L=10
### Detailed Analysis
* **CUSUM (Blue):** Starts at approximately 0.06 at N=100, increases to approximately 0.085 at N=200, decreases to approximately 0.06 at N=400, then increases and plateaus around 0.075 from N=500 to N=600, and finally decreases to approximately 0.06 at N=700.
* **m^(1), L=1 (Orange):** Starts at approximately 0.165 at N=100, decreases sharply to approximately 0.085 at N=200, then gradually decreases to approximately 0.06 at N=700.
* **m^(2), L=1 (Green):** Starts at approximately 0.13 at N=100, decreases sharply to approximately 0.085 at N=200, then gradually decreases to approximately 0.06 at N=700.
* **m^(1), L=5 (Red):** Starts at approximately 0.077 at N=100, decreases slightly to approximately 0.075 at N=200, then decreases to approximately 0.057 at N=400, increases slightly to approximately 0.06 at N=500, and then decreases to approximately 0.055 at N=700.
* **m^(1), L=10 (Purple):** Starts at approximately 0.062 at N=100, increases slightly to approximately 0.075 at N=200, then decreases to approximately 0.052 at N=600, and increases slightly to approximately 0.055 at N=700.
### Key Observations
* The algorithms m^(1), L=1 and m^(2), L=1 have the highest MER Average at N=100, but decrease sharply as N increases.
* The CUSUM algorithm has a relatively stable MER Average across different values of N, with a slight increase and plateau between N=500 and N=600.
* The algorithms m^(1), L=5 and m^(1), L=10 have the lowest MER Average across different values of N.
### Interpretation
The chart compares the performance of different algorithms in terms of MER Average as a function of N. The algorithms m^(1), L=1 and m^(2), L=1 initially have high error rates, but their performance improves significantly as N increases. The CUSUM algorithm has a more stable performance, while the algorithms m^(1), L=5 and m^(1), L=10 consistently have the lowest error rates. This suggests that the choice of algorithm and its parameters can significantly impact the MER Average. The optimal choice depends on the specific application and the desired trade-off between initial error rate and stability.