## Line Chart: MER Average vs. N for Different Methods
### Overview
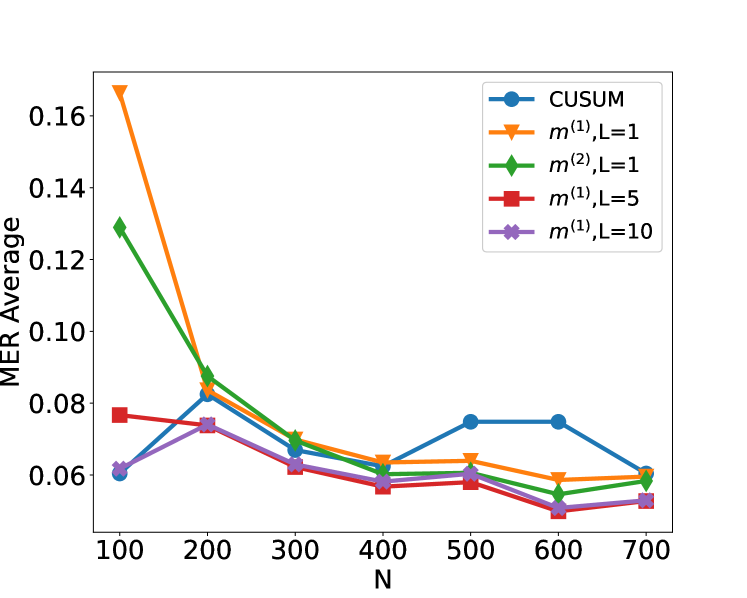
This is a line chart comparing the performance of five different statistical methods or parameter settings. The chart plots the "MER Average" (y-axis) against a variable "N" (x-axis), which likely represents sample size, number of observations, or a similar parameter. The general trend shows that the MER Average decreases for most methods as N increases, suggesting improved performance with larger N.
### Components/Axes
* **Chart Type:** Multi-series line chart with markers.
* **X-Axis:**
* **Label:** `N`
* **Scale:** Linear, ranging from 100 to 700.
* **Tick Marks:** 100, 200, 300, 400, 500, 600, 700.
* **Y-Axis:**
* **Label:** `MER Average`
* **Scale:** Linear, ranging from approximately 0.05 to 0.17.
* **Tick Marks:** 0.06, 0.08, 0.10, 0.12, 0.14, 0.16.
* **Legend:** Located in the top-right corner of the plot area. It defines five data series:
1. `CUSUM` (Blue line, circle marker)
2. `m^(1),L=1` (Orange line, downward-pointing triangle marker)
3. `m^(2),L=1` (Green line, diamond marker)
4. `m^(1),L=5` (Red line, square marker)
5. `m^(1),L=10` (Purple line, 'x' or cross marker)
### Detailed Analysis
**Data Series Trends and Approximate Values:**
1. **CUSUM (Blue, Circles):**
* **Trend:** Starts low, increases to a peak, then declines. It is the only series that shows a significant increase in the middle range of N.
* **Approximate Values:**
* N=100: ~0.060
* N=200: ~0.082
* N=300: ~0.068
* N=400: ~0.062
* N=500: ~0.075
* N=600: ~0.075
* N=700: ~0.060
2. **m^(1),L=1 (Orange, Triangles):**
* **Trend:** Starts at the highest point on the chart and exhibits a steep, consistent decline as N increases, flattening out for N > 400.
* **Approximate Values:**
* N=100: ~0.167
* N=200: ~0.088
* N=300: ~0.070
* N=400: ~0.064
* N=500: ~0.064
* N=600: ~0.059
* N=700: ~0.060
3. **m^(2),L=1 (Green, Diamonds):**
* **Trend:** Starts at the second-highest point and follows a steep decline similar to `m^(1),L=1`, converging with it at higher N.
* **Approximate Values:**
* N=100: ~0.129
* N=200: ~0.085
* N=300: ~0.069
* N=400: ~0.060
* N=500: ~0.059
* N=600: ~0.055
* N=700: ~0.059
4. **m^(1),L=5 (Red, Squares):**
* **Trend:** Starts at a moderate level and shows a gradual, relatively steady decline across all N values.
* **Approximate Values:**
* N=100: ~0.077
* N=200: ~0.074
* N=300: ~0.062
* N=400: ~0.057
* N=500: ~0.059
* N=600: ~0.050
* N=700: ~0.054
5. **m^(1),L=10 (Purple, Crosses):**
* **Trend:** Starts at a low level, similar to CUSUM, and shows a very gradual decline, remaining the lowest or among the lowest series for most N values.
* **Approximate Values:**
* N=100: ~0.062
* N=200: ~0.074
* N=300: ~0.063
* N=400: ~0.058
* N=500: ~0.058
* N=600: ~0.050
* N=700: ~0.054
### Key Observations
1. **Convergence:** All five methods converge to a narrow range of MER Average values (approximately 0.050 to 0.060) as N approaches 700.
2. **Initial Performance Disparity:** At low N (100), there is a large disparity in performance. The `m^(1),L=1` method has a very high MER (~0.167), while `CUSUM` and `m^(1),L=10` are much lower (~0.06).
3. **CUSUM Anomaly:** The `CUSUM` method is the only one that does not follow a strictly decreasing trend. It shows a notable increase in MER Average between N=400 and N=500, creating a local peak.
4. **Effect of Parameter L:** For the `m^(1)` family of methods, increasing the parameter `L` (from 1 to 5 to 10) appears to lower the initial MER Average at N=100 and results in a flatter, more stable performance curve across all N.
5. **Steep Initial Descent:** The methods with `L=1` (`m^(1),L=1` and `m^(2),L=1`) show the most dramatic improvement (steepest negative slope) as N increases from 100 to 300.
### Interpretation
The chart demonstrates the relationship between sample size (N) and the average Misclassification Error Rate (MER) for different change-point detection or sequential analysis algorithms. The key takeaway is that **larger sample sizes (N) generally lead to lower error rates for all tested methods**, with the most significant gains occurring as N increases from 100 to about 400.
The data suggests a trade-off controlled by the parameter `L`. Methods with a small `L` (L=1) are highly sensitive and perform poorly with little data but improve rapidly. Methods with a larger `L` (L=5, L=10) are more robust to small sample sizes, starting with lower error, but their rate of improvement is slower. The `CUSUM` method, a classic benchmark, shows non-monotonic behavior, indicating potential instability or a specific sensitivity in the mid-range of N for this particular experimental setup.
The convergence of all lines at high N implies that with sufficient data, the choice of method or parameter `L` becomes less critical for achieving a low MER. The critical decision point is for applications where N is small or moderate (100-400), where method selection has a substantial impact on performance.