\n
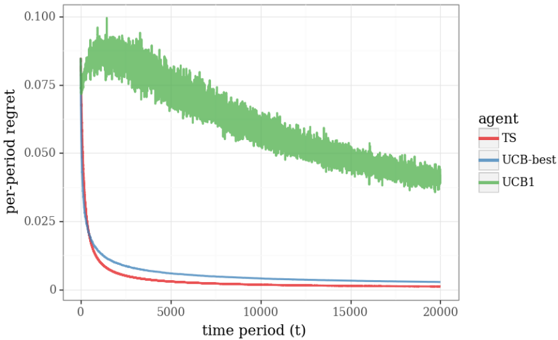
## Line Chart: Per-Period Regret of Multi-Armed Bandit Algorithms
### Overview
The image displays a line chart comparing the performance of three different multi-armed bandit algorithms over 20,000 time periods. The performance metric is "per-period regret," where a lower value indicates better performance. The chart shows that all algorithms improve (regret decreases) over time, but at significantly different rates and with different stability profiles.
### Components/Axes
* **Chart Type:** Line chart with three data series.
* **X-Axis:** Labeled "time period (t)". It is a linear scale ranging from 0 to 20,000, with major tick marks at 0, 5000, 10000, 15000, and 20000.
* **Y-Axis:** Labeled "per-period regret". It is a linear scale ranging from 0.000 to 0.100, with major tick marks at 0.000, 0.025, 0.050, 0.075, and 0.100.
* **Legend:** Positioned on the right side of the chart, outside the plot area. It is titled "agent" and lists three entries:
* **TS:** Represented by a solid red line.
* **UCB-best:** Represented by a solid blue line.
* **UCB1:** Represented by a solid green line with a shaded green area around it, indicating variance or confidence intervals.
### Detailed Analysis
**1. TS (Red Line):**
* **Trend:** Shows a very sharp, near-vertical decline in regret at the very beginning (t ≈ 0 to ~500). After this initial drop, the curve flattens out, maintaining a very low and stable regret level for the remainder of the timeline.
* **Key Data Points (Approximate):**
* At t=0, regret starts high (off the chart, >0.100).
* By t=500, regret has plummeted to approximately 0.010.
* From t=5000 to t=20000, regret remains consistently low, appearing to be below 0.005 and approaching zero asymptotically.
**2. UCB-best (Blue Line):**
* **Trend:** Exhibits a smooth, convex decay curve. It decreases rapidly at first, but more gradually than TS, and continues to decline steadily throughout the entire period.
* **Key Data Points (Approximate):**
* Starts at a similar high point as TS at t=0.
* At t=500, regret is approximately 0.020 (higher than TS at the same point).
* At t=5000, regret is approximately 0.008.
* At t=20000, regret is very low, approximately 0.002, slightly above the TS line.
**3. UCB1 (Green Line & Shaded Area):**
* **Trend:** Shows a dramatically different pattern. It initially spikes upward, reaching a peak regret within the first ~1000 periods. After this peak, it begins a slow, noisy, but consistent downward trend. The line is highly volatile (noisy), and the wide shaded green area indicates high variance in its performance across runs or trials.
* **Key Data Points (Approximate):**
* Starts high at t=0.
* Peaks at approximately t=1000 with a regret value of ~0.090.
* At t=5000, regret has decreased to ~0.075.
* At t=10000, regret is ~0.060.
* At t=20000, regret is approximately 0.040, which is still an order of magnitude higher than the other two algorithms.
### Key Observations
1. **Performance Hierarchy:** There is a clear and persistent performance gap. TS is the best performer (lowest regret), followed closely by UCB-best. UCB1 performs significantly worse than the other two throughout the entire observed timeframe.
2. **Convergence Speed:** TS converges to near-optimal performance (very low regret) extremely quickly. UCB-best converges more slowly but steadily. UCB1 converges very slowly.
3. **Stability/Variance:** The TS and UCB-best lines are smooth, suggesting stable, low-variance performance. The UCB1 line is extremely noisy, and its associated shaded region confirms high variance, meaning its performance is less predictable and consistent.
4. **Initial Behavior:** UCB1 is the only algorithm that shows an initial *increase* in per-period regret before it begins to improve.
### Interpretation
This chart visualizes a classic comparison in reinforcement learning/multi-armed bandit problems, evaluating the efficiency of exploration-exploitation strategies.
* **What the data suggests:** The "TS" (likely Thompson Sampling) algorithm demonstrates superior sample efficiency. It quickly identifies the best action and exploits it, leading to minimal regret. "UCB-best" (an Upper Confidence Bound algorithm, possibly with optimized parameters) also performs well but learns at a slightly slower pace. "UCB1" (a standard UCB algorithm) appears to be overly exploratory in this setting. Its initial regret spike and persistently high, noisy regret suggest it spends too much time exploring suboptimal actions, leading to a much higher cumulative cost (regret).
* **Relationship between elements:** The x-axis (time) shows the learning process. The y-axis (regret) quantifies the cost of learning. The stark separation between the green line (UCB1) and the other two highlights the practical impact of algorithm choice. The shaded area for UCB1 is critical—it shows that not only is its average performance worse, but its performance is also highly unreliable compared to the deterministic, smooth curves of TS and UCB-best.
* **Notable Anomaly:** The initial upward spike for UCB1 is a key anomaly. It indicates that in the very early stages, this algorithm makes a sequence of decisions that are *worse* than a random baseline, accumulating regret rapidly before its learning mechanism corrects course. This is a significant drawback for applications where early performance is critical.
**Language Note:** All text in the image is in English. No other languages are present.