## Line Graph: Per-Period Regret Over Time
### Overview
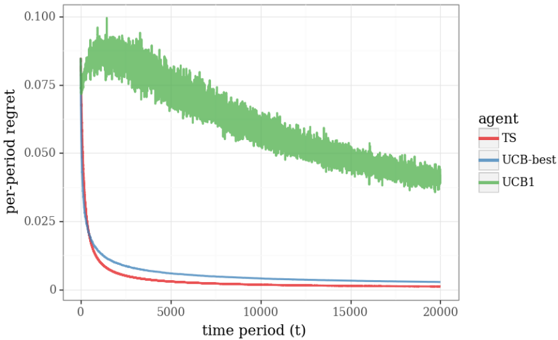
The image depicts a line graph comparing the per-period regret of three agents (TS, UCB-best, UCB1) across 20,000 time periods. The y-axis represents regret values (0 to 0.100), while the x-axis represents time periods (0 to 20,000). The graph shows distinct performance trends for each agent, with sharp initial declines followed by stabilization.
### Components/Axes
- **Y-Axis**: "per-period regret" (0 to 0.100 in increments of 0.025).
- **X-Axis**: "time period (t)" (0 to 20,000 in increments of 5,000).
- **Legend**: Located on the right, with three entries:
- Red: TS
- Blue: UCB-best
- Green: UCB1
### Detailed Analysis
1. **TS (Red Line)**:
- Starts at ~0.075 regret at t=0.
- Drops sharply to ~0.025 by t=5,000.
- Remains stable near 0.025 for the remainder of the period.
- Final value at t=20,000: ~0.025.
2. **UCB-best (Blue Line)**:
- Starts at ~0.075 regret at t=0.
- Declines gradually to ~0.025 by t=10,000.
- Stabilizes near 0.025 for the remainder of the period.
- Final value at t=20,000: ~0.025.
3. **UCB1 (Green Line)**:
- Starts at ~0.075 regret at t=0.
- Declines slowly to ~0.05 by t=10,000.
- Remains elevated (~0.05) until t=20,000.
- Final value at t=20,000: ~0.05.
- Exhibits jagged fluctuations (noise) throughout the period.
### Key Observations
- **TS and UCB-best** exhibit similar initial performance but diverge in decline rate. TS stabilizes faster than UCB-best.
- **UCB1** consistently underperforms compared to the other two agents, maintaining higher regret values throughout.
- The green line (UCB1) shows significant noise, suggesting higher variability in its regret measurements.
- All agents experience a sharp initial drop in regret, indicating rapid adaptation or learning.
### Interpretation
The graph demonstrates that **TS and UCB-best** are more effective at minimizing regret over time compared to **UCB1**. The rapid decline in TS and UCB-best suggests these agents adapt more efficiently to the task, while UCB1’s slower decline and persistent noise imply suboptimal performance or instability. The stabilization phases indicate that all agents eventually reach a steady state, but UCB1’s higher final regret (~0.05 vs. ~0.025) highlights its inferiority. The noise in UCB1’s data may reflect measurement errors or environmental variability not present in the other agents’ systems.