## Bar Chart: Accuracy (%) vs. Length of Paths in SPARQL
### Overview
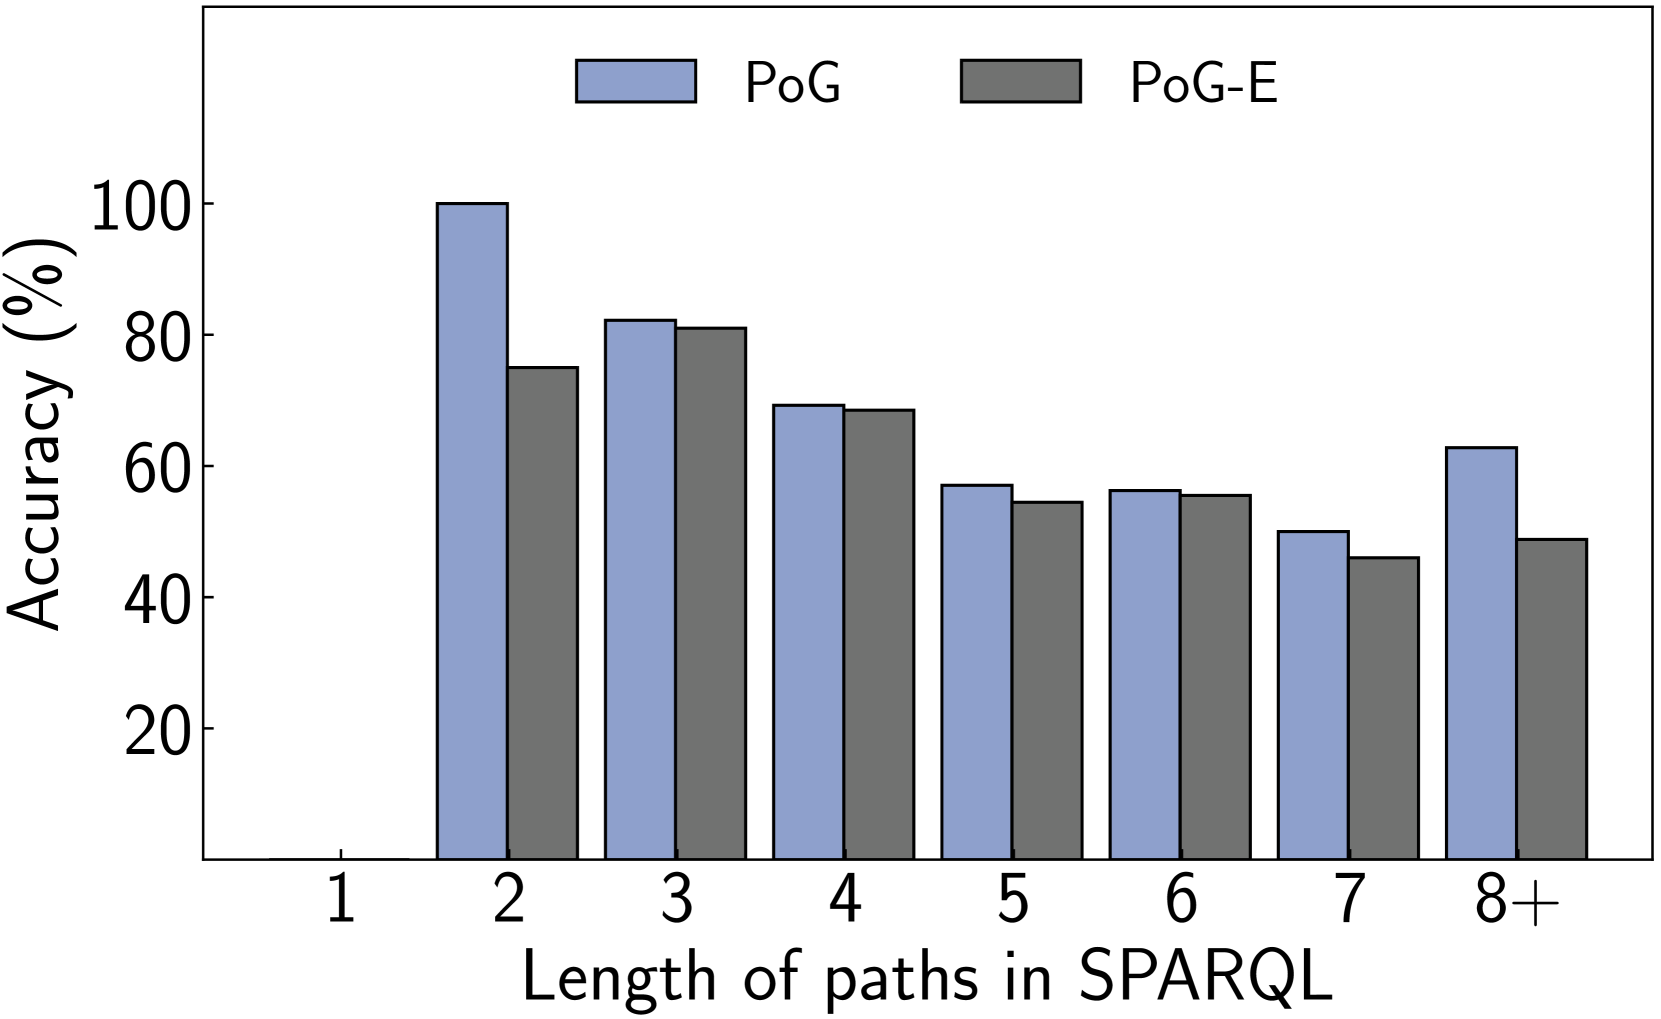
The chart compares the accuracy of two systems, **PoG** (blue) and **PoG-E** (gray), across varying lengths of SPARQL query paths. Accuracy is measured in percentage, with path lengths categorized as 1, 2, 3, 4, 5, 6, 7, and "8+". The legend is positioned at the top, with PoG in blue and PoG-E in gray.
### Components/Axes
- **Y-axis**: Accuracy (%) ranging from 0 to 100% in 20% increments.
- **X-axis**: Path lengths labeled as 1, 2, 3, 4, 5, 6, 7, and "8+".
- **Legend**: Located at the top, associating blue with PoG and gray with PoG-E.
### Detailed Analysis
- **Path Length 1**: No data (0% accuracy for both systems).
- **Path Length 2**:
- PoG: ~100% accuracy.
- PoG-E: ~75% accuracy.
- **Path Length 3**:
- PoG: ~80% accuracy.
- PoG-E: ~80% accuracy.
- **Path Length 4**:
- PoG: ~70% accuracy.
- PoG-E: ~70% accuracy.
- **Path Length 5**:
- PoG: ~55% accuracy.
- PoG-E: ~50% accuracy.
- **Path Length 6**:
- PoG: ~55% accuracy.
- PoG-E: ~55% accuracy.
- **Path Length 7**:
- PoG: ~50% accuracy.
- PoG-E: ~45% accuracy.
- **Path Length 8+**:
- PoG: ~60% accuracy.
- PoG-E: ~50% accuracy.
### Key Observations
1. **PoG Dominates Shorter Paths**: PoG achieves near-perfect accuracy (100%) for path length 2, while PoG-E lags at ~75%.
2. **Convergence at Medium Paths**: At path lengths 3 and 4, both systems show similar accuracy (~70-80%).
3. **Decline in Longer Paths**: Accuracy drops for both systems as path length increases beyond 4, with PoG-E consistently underperforming PoG.
4. **Slight Uptick at 8+**: PoG shows a modest recovery (~60%) for very long paths, while PoG-E remains lower (~50%).
### Interpretation
The data suggests that **PoG** is more effective than **PoG-E** in handling shorter SPARQL query paths, achieving near-perfect accuracy for path length 2. Both systems degrade in performance as path length increases, but PoG-E consistently underperforms, indicating potential limitations in handling complex or longer queries. The slight improvement in PoG’s accuracy for path length "8+" may imply better scalability for extremely long paths, though this trend is less pronounced. The convergence at medium path lengths (3-4) suggests both systems are similarly capable in moderately complex scenarios. PoG-E’s lower accuracy across most categories highlights a need for optimization in longer-path processing.