## Technical Description of Scatter Plots
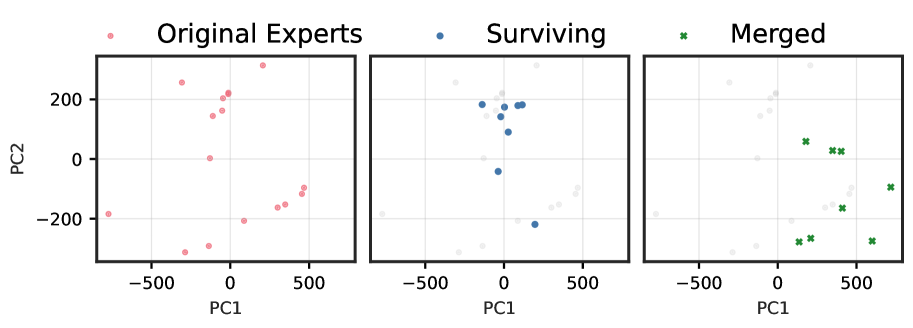
The image presents three side-by-side scatter plots, all sharing the same axes and scale. The plots visualize data points in a two-dimensional principal component space defined by PC1 and PC2.
### Common Axis Information
* **Y-axis:** Labeled "PC2". Major tick marks and labels are present at -200, 0, and 200. The visible range extends from approximately -350 to 350.
* **X-axis:** Labeled "PC1". Major tick marks and labels are present at -500, 0, and 500. The visible range extends from approximately -750 to 750.
* **Grid:** A light gray grid is overlaid on all three plots, corresponding to the major tick marks.
### Plot 1: Original Experts (Left)
* **Title:** "Original Experts"
* **Legend:** A red circle marker is associated with this title.
* **Data Points:** The plot displays a set of red circle markers scattered across the PC1-PC2 plane. The points are distributed in several clusters and isolated locations:
* A cluster of points is located in the upper-left quadrant, roughly between PC1 -300 to 0 and PC2 150 to 250.
* A single point is near PC1 -100, PC2 0.
* A cluster is in the lower-left quadrant, around PC1 -300 to -100 and PC2 -300 to -250.
* An isolated point is at the far left, near PC1 -700, PC2 -180.
* A cluster is in the lower-right quadrant, roughly between PC1 100 to 500 and PC2 -200 to -100.
* An isolated point is in the upper-right quadrant, near PC1 200, PC2 300.
### Plot 2: Surviving (Middle)
* **Title:** "Surviving"
* **Legend:** A blue circle marker is associated with this title.
* **Data Points:**
* **Foreground (Blue Circles):** A subset of the points from the "Original Experts" plot are highlighted in blue. These "Surviving" points are primarily concentrated in the central region of the plot, roughly between PC1 -100 to 200 and PC2 -220 to 200.
* **Background (Gray Circles):** The remaining points from the "Original Experts" set, which are not part of the "Surviving" group, are shown as faint gray circles in the background, providing context.
### Plot 3: Merged (Right)
* **Title:** "Merged"
* **Legend:** A green 'x' marker is associated with this title.
* **Data Points:**
* **Foreground (Green 'x's):** A different set of points are shown with green 'x' markers. These "Merged" points are located in the right half of the plot, roughly between PC1 100 to 700 and PC2 -280 to 100.
* **Background (Gray Circles):** Similar to the middle plot, the "Original Experts" data points are shown as faint gray circles in the background for context. The green 'x' markers appear to be in different locations than the original gray points, suggesting they represent new or modified data points rather than a simple subset.