## Line Chart: Performance vs. Epochs for Different PNN Sizes
### Overview
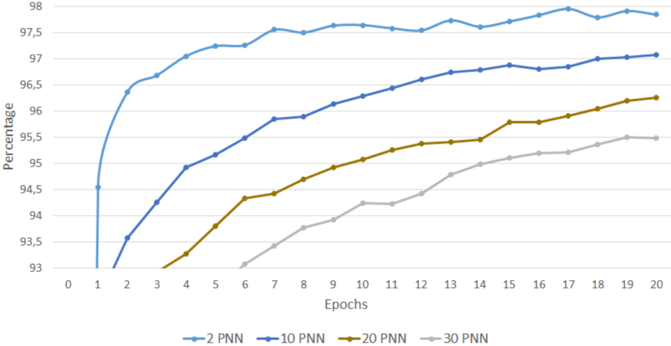
This image presents a line chart illustrating the performance (in percentage) of different Proximity Neural Network (PNN) sizes (2, 10, 20, and 30) across 20 epochs. The chart visually demonstrates how the performance of each PNN size evolves with increasing training epochs.
### Components/Axes
* **X-axis:** "Epochs" - ranging from 0 to 20, with markers at integer values.
* **Y-axis:** "Percentage" - ranging from 93 to 98, with markers at 0.5 percentage intervals.
* **Legend:** Located at the bottom of the chart, identifying each line with its corresponding PNN size.
* Blue Line: "2 PNN"
* Dark Blue Line: "10 PNN"
* Orange Line: "20 PNN"
* Gray Line: "30 PNN"
### Detailed Analysis
The chart displays four distinct lines, each representing the performance of a PNN with a different number of neurons.
* **2 PNN (Blue Line):** This line starts at approximately 93.2% at Epoch 0 and rapidly increases to around 97.8% at Epoch 2. It then plateaus, fluctuating between approximately 97.5% and 97.9% for the remaining epochs (2-20).
* Epoch 0: ~93.2%
* Epoch 1: ~96.8%
* Epoch 2: ~97.8%
* Epoch 5: ~97.6%
* Epoch 10: ~97.7%
* Epoch 15: ~97.6%
* Epoch 20: ~97.8%
* **10 PNN (Dark Blue Line):** This line begins at approximately 94.2% at Epoch 0 and steadily increases, reaching around 97.2% at Epoch 20. The increase is less rapid than the 2 PNN line, but more consistent.
* Epoch 0: ~94.2%
* Epoch 1: ~95.8%
* Epoch 2: ~96.5%
* Epoch 5: ~96.8%
* Epoch 10: ~97.0%
* Epoch 15: ~97.1%
* Epoch 20: ~97.2%
* **20 PNN (Orange Line):** Starting at approximately 93.8% at Epoch 0, this line exhibits a slower initial increase compared to the 2 and 10 PNN lines. It reaches around 96.5% at Epoch 20.
* Epoch 0: ~93.8%
* Epoch 1: ~94.8%
* Epoch 2: ~95.4%
* Epoch 5: ~95.8%
* Epoch 10: ~96.1%
* Epoch 15: ~96.3%
* Epoch 20: ~96.5%
* **30 PNN (Gray Line):** This line shows the slowest increase in performance, starting at approximately 93.4% at Epoch 0 and reaching around 95.7% at Epoch 20.
* Epoch 0: ~93.4%
* Epoch 1: ~94.0%
* Epoch 2: ~94.4%
* Epoch 5: ~94.7%
* Epoch 10: ~95.0%
* Epoch 15: ~95.3%
* Epoch 20: ~95.7%
### Key Observations
* The 2 PNN model achieves the highest performance and reaches a plateau relatively quickly.
* Increasing the PNN size beyond 2 neurons results in diminishing returns in terms of performance improvement.
* The 30 PNN model consistently exhibits the lowest performance across all epochs.
* All models show an initial rapid increase in performance, followed by a diminishing rate of improvement.
### Interpretation
The data suggests that for this particular task, a smaller PNN size (specifically 2 neurons) is more effective than larger sizes. This could be due to overfitting with larger networks or the inherent simplicity of the problem. The rapid initial improvement indicates that the models quickly learn the basic patterns in the data. The plateauing performance suggests that further training epochs do not significantly improve the model's accuracy, and the model has likely converged. The decreasing performance with increasing PNN size indicates that the complexity of the model is not beneficial and may even be detrimental to generalization. This could be because the larger networks are more prone to overfitting the training data, leading to poorer performance on unseen data. The chart provides valuable insights into the optimal PNN size for this specific application, highlighting the importance of model selection and avoiding unnecessary complexity.