## Line Chart: Performance of PNN Configurations Over Training Epochs
### Overview
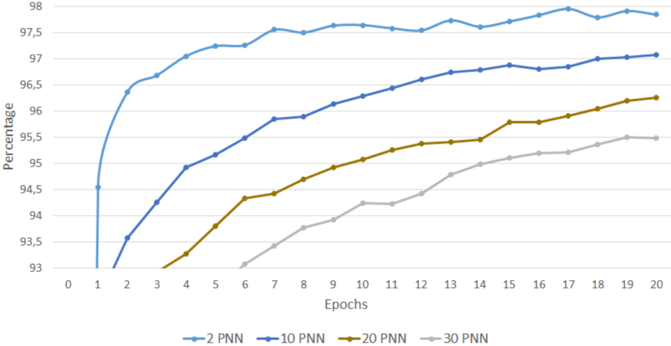
The chart displays the percentage performance of four different PNN (Probabilistic Neural Network) configurations (2 PNN, 10 PNN, 20 PNN, 30 PNN) across 20 training epochs. Performance is measured on a y-axis from 93% to 98%, with epochs on the x-axis from 0 to 20. All lines show upward trends, but with varying rates of improvement.
### Components/Axes
- **X-axis (Epochs)**: Labeled "Epochs," ranging from 0 to 20 in increments of 1.
- **Y-axis (Percentage)**: Labeled "Percentage," ranging from 93% to 98% in increments of 0.5%.
- **Legend**: Located at the bottom, with four lines:
- **Blue**: 2 PNN
- **Dark Blue**: 10 PNN
- **Brown**: 20 PNN
- **Gray**: 30 PNN
### Detailed Analysis
1. **2 PNN (Blue Line)**:
- Starts at **94.5%** at epoch 1.
- Rises sharply to **97.5%** by epoch 2.
- Plateaus between **97.5%–98%** for epochs 3–20.
- *Trend*: Rapid initial improvement, then stabilization.
2. **10 PNN (Dark Blue Line)**:
- Starts at **93.5%** at epoch 1.
- Increases steadily to **96.5%** by epoch 20.
- *Trend*: Consistent linear growth.
3. **20 PNN (Brown Line)**:
- Starts at **93%** at epoch 1.
- Rises to **95.5%** by epoch 20.
- *Trend*: Gradual, steady increase.
4. **30 PNN (Gray Line)**:
- Starts at **93%** at epoch 1.
- Increases to **95.5%** by epoch 20.
- *Trend*: Slow, linear growth.
### Key Observations
- The **2 PNN** configuration achieves the highest performance (97.5–98%) but plateaus early.
- **10 PNN** shows the most sustained improvement, reaching 96.5% by epoch 20.
- **20 PNN** and **30 PNN** have similar final performance (~95.5%) but differ in growth rate (20 PNN improves faster).
- All configurations improve over time, but higher PNN values (2–10) outperform lower values (20–30).
### Interpretation
The chart suggests that **PNN configuration significantly impacts model performance**, with higher PNN values (2–10) achieving better results faster. However, the 2 PNN configuration plateaus early, indicating diminishing returns after initial training. The 20 PNN and 30 PNN lines demonstrate that lower PNN values require more epochs to converge but may stabilize at lower performance levels. This could imply a trade-off between computational efficiency (fewer PNNs) and model accuracy, with optimal performance achieved at mid-range PNN values (e.g., 10 PNN). The data highlights the importance of tuning PNN parameters for specific training goals.