## Line Chart: Training Loss Comparison by Initialization and Normalization
### Overview
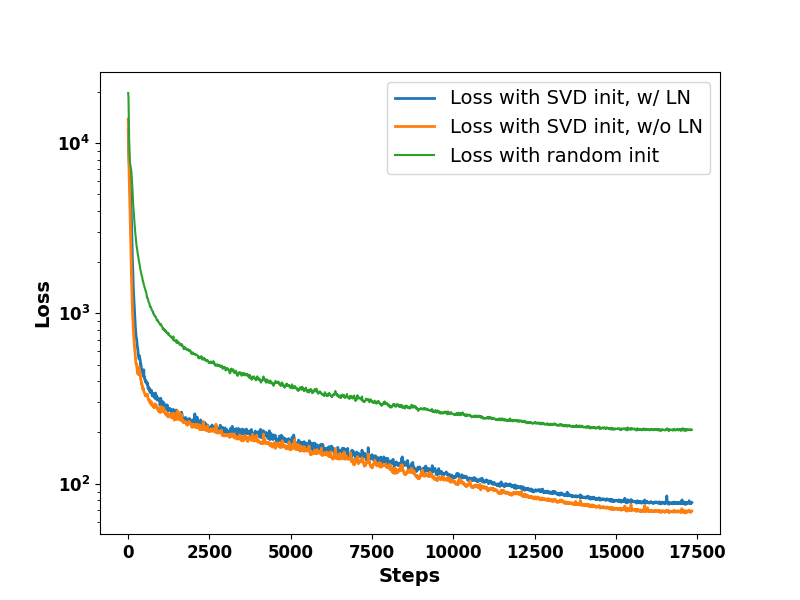
This chart illustrates the training loss trajectory over 17,500 steps for a machine learning model under three distinct experimental conditions. The Y-axis uses a logarithmic scale to capture the rapid initial decline in loss, while the X-axis represents the progression of training steps.
### Components/Axes
* **X-Axis:** Labeled "Steps". The scale ranges from 0 to 17,500, with major grid markers at intervals of 2,500.
* **Y-Axis:** Labeled "Loss". The scale is logarithmic, spanning from $10^2$ (100) to $10^4$ (10,000).
* **Legend:** Positioned in the top-right quadrant of the chart area.
* **Blue Line:** "Loss with SVD init, w/ LN" (Singular Value Decomposition initialization with Layer Normalization).
* **Orange Line:** "Loss with SVD init, w/o LN" (Singular Value Decomposition initialization without Layer Normalization).
* **Green Line:** "Loss with random init" (Random initialization).
### Detailed Analysis
**Trend Verification:**
* **Initial Phase (0–1,000 steps):** All three series exhibit a sharp, near-vertical drop in loss from approximately $2 \times 10^4$ (20,000).
* **Intermediate Phase (1,000–10,000 steps):** The Green line (Random init) separates significantly from the SVD-initialized lines, maintaining a higher loss value. The Blue and Orange lines track closely together, showing a consistent downward slope.
* **Final Phase (10,000–17,500 steps):** The Green line begins to plateau, showing very little improvement. The Blue and Orange lines continue to decline, albeit at a slower rate than the initial phase.
**Approximate Data Points:**
| Step | Green (Random) | Blue (SVD w/ LN) | Orange (SVD w/o LN) |
| :--- | :--- | :--- | :--- |
| **0** | $\approx 20,000$ | $\approx 20,000$ | $\approx 20,000$ |
| **2,500** | $\approx 500$ | $\approx 250$ | $\approx 250$ |
| **7,500** | $\approx 300$ | $\approx 150$ | $\approx 150$ |
| **12,500** | $\approx 230$ | $\approx 100$ | $\approx 90$ |
| **17,500** | $\approx 210$ | $\approx 80$ | $\approx 70$ |
*(Note: Values are estimated based on visual inspection of the logarithmic scale.)*
### Key Observations
* **Initialization Superiority:** SVD initialization is clearly superior to random initialization for this task, resulting in a final loss roughly 3x lower than the random initialization baseline.
* **Normalization Impact:** The impact of Layer Normalization (LN) is negligible in this context. The Blue and Orange lines are nearly identical, with the "w/o LN" (Orange) configuration achieving a marginally lower final loss than the "w/ LN" (Blue) configuration.
* **Convergence Behavior:** The random initialization model appears to reach convergence (plateau) around 12,500 steps, whereas the SVD-initialized models show continued, albeit slow, improvement through the end of the 17,500 steps.
### Interpretation
The data demonstrates that the initialization strategy is the primary driver of performance in this experiment. By using SVD initialization, the model starts in a more favorable region of the loss landscape, allowing for faster and more effective optimization compared to random initialization.
The observation that the model performs slightly better *without* Layer Normalization is notable. In many deep learning architectures, Layer Normalization is used to stabilize training; however, here it appears to offer no benefit and may even slightly impede the optimization process. This suggests that the SVD initialization provides sufficient stability on its own, rendering the additional normalization layer redundant or slightly detrimental for this specific architecture.