## Line Graph: Loss vs. Training Steps for Different Initialization Methods
### Overview
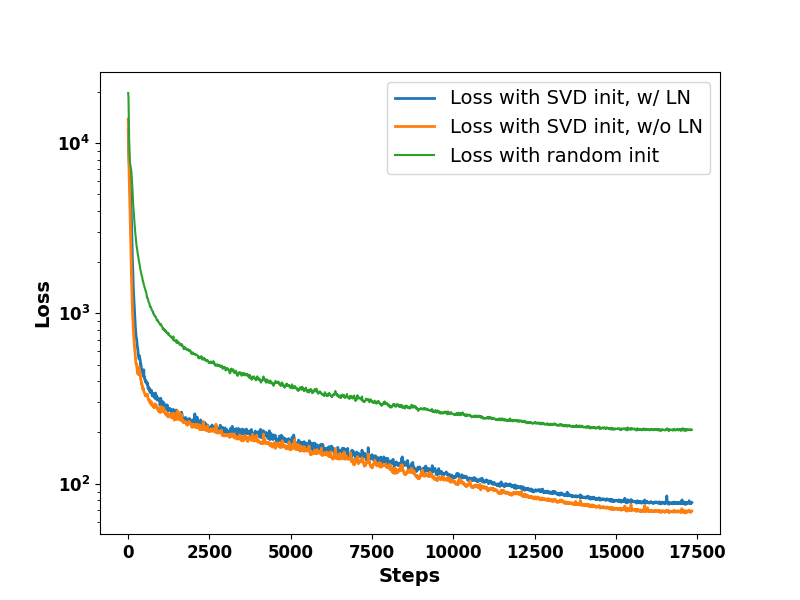
The graph depicts the convergence of loss values over training steps for three initialization strategies in a machine learning model. The y-axis uses a logarithmic scale (10² to 10⁴), while the x-axis spans 0 to 17,500 steps. Three lines represent distinct initialization approaches, with loss decreasing over time for all methods.
### Components/Axes
- **X-axis (Steps)**: Ranges from 0 to 17,500 in increments of 2,500.
- **Y-axis (Loss)**: Logarithmic scale from 10² to 10⁴.
- **Legend**: Located in the top-right corner, with three entries:
- **Blue**: "Loss with SVD init, w/ LN" (Layer Normalization)
- **Orange**: "Loss with SVD init, w/o LN"
- **Green**: "Loss with random init"
### Detailed Analysis
1. **Blue Line (SVD init, w/ LN)**:
- Starts at ~10⁴ loss at step 0.
- Rapidly declines to ~10² by step 2,500.
- Maintains a steady decline, reaching ~10¹ by step 17,500.
- Shows minor fluctuations but remains the lowest loss throughout.
2. **Orange Line (SVD init, w/o LN)**:
- Begins at ~10⁴ loss at step 0.
- Declines faster than the green line but slower than the blue line.
- Reaches ~10¹ by step 17,500, slightly above the blue line.
- Exhibits minor oscillations but follows a consistent downward trend.
3. **Green Line (Random init)**:
- Starts at ~10⁴ loss at step 0.
- Declines more gradually than the blue/orange lines.
- Reaches ~10² by step 17,500, remaining the highest loss.
- Shows a smoother curve with fewer fluctuations.
### Key Observations
- **Convergence Rates**: SVD initialization (blue/orange) converges significantly faster than random initialization (green).
- **Layer Normalization Impact**: The blue line (with LN) consistently outperforms the orange line (without LN), suggesting LN improves stability.
- **Logarithmic Scale**: The y-axis emphasizes early-stage loss differences, which diminish as training progresses.
### Interpretation
The data demonstrates that **SVD initialization with layer normalization (blue line)** achieves the lowest loss, indicating superior performance for this model. The orange line (SVD without LN) performs better than random initialization (green) but lags behind the LN-augmented approach. This suggests that layer normalization is critical for stabilizing training dynamics when using SVD initialization. The logarithmic scale highlights early-stage optimization efficiency, while the linear decline in later steps reflects diminishing returns as the model approaches convergence. The green line’s higher loss underscores the limitations of random initialization in this context.