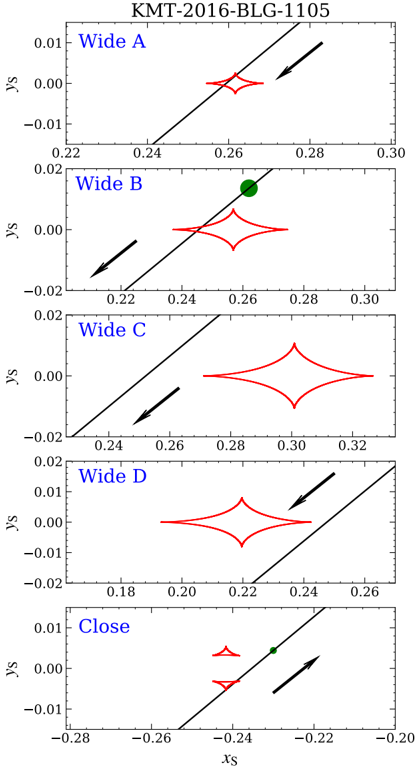
## Chart/Diagram Type: Parameter Space Plots
### Overview
The image presents a series of five 2D plots, each displaying a parameter space with a red, closed contour and a black line. The plots are titled "Wide A", "Wide B", "Wide C", "Wide D", and "Close". Each plot has axes labeled 'xs' and 'ys'. The plots show how the red contour changes shape and position across different parameter ranges. Arrows are present in each plot, indicating a direction. Two of the plots, "Wide B" and "Close", also contain a green dot. The title of the entire figure is "KMT-2016-BLG-1105".
### Components/Axes
* **Title:** KMT-2016-BLG-1105
* **Plot Titles:** Wide A, Wide B, Wide C, Wide D, Close (arranged vertically)
* **X-axis (xs):**
* Wide A: 0.22 to 0.30
* Wide B: 0.22 to 0.30
* Wide C: 0.24 to 0.32
* Wide D: 0.18 to 0.26
* Close: -0.28 to -0.20
* **Y-axis (ys):**
* Wide A: -0.01 to 0.01
* Wide B: -0.02 to 0.02
* Wide C: -0.02 to 0.02
* Wide D: -0.02 to 0.02
* Close: -0.01 to 0.01
* **Data Elements:**
* Red closed contour (shape varies across plots)
* Black line (appears to be a linear function)
* Black arrow (direction indicator)
* Green dot (present in "Wide B" and "Close" plots)
### Detailed Analysis or Content Details
**Wide A:**
* xs ranges from 0.22 to 0.30
* ys ranges from -0.01 to 0.01
* Red contour is centered around xs = 0.26, ys = 0.00
* Black line slopes upwards from left to right.
* Arrow points towards the top-right.
**Wide B:**
* xs ranges from 0.22 to 0.30
* ys ranges from -0.02 to 0.02
* Red contour is centered around xs = 0.26, ys = 0.00
* Black line slopes upwards from left to right.
* Green dot is located at approximately xs = 0.26, ys = 0.015
* Arrow points towards the bottom-left.
**Wide C:**
* xs ranges from 0.24 to 0.32
* ys ranges from -0.02 to 0.02
* Red contour is centered around xs = 0.29, ys = 0.00
* Black line slopes upwards from left to right.
* Arrow points towards the bottom-left.
**Wide D:**
* xs ranges from 0.18 to 0.26
* ys ranges from -0.02 to 0.02
* Red contour is centered around xs = 0.22, ys = 0.00
* Black line slopes upwards from left to right.
* Arrow points towards the top-right.
**Close:**
* xs ranges from -0.28 to -0.20
* ys ranges from -0.01 to 0.01
* Red contour is centered around xs = -0.24, ys = -0.005
* Black line slopes upwards from left to right.
* Green dot is located at approximately xs = -0.225, ys = 0.005
* Arrow points towards the top-right.
### Key Observations
* The red contour shape varies across the plots, suggesting different parameter configurations.
* The black line represents a consistent linear relationship in each plot.
* The green dot appears in two plots ("Wide B" and "Close"), potentially indicating a specific condition or data point of interest.
* The arrows indicate a direction, possibly representing a gradient or flow within the parameter space.
* The x-axis range varies between plots.
### Interpretation
The plots likely represent different regions or scales within a parameter space related to the KMT-2016-BLG-1105 event. The red contours could represent regions of interest or confidence intervals for a particular model. The black line might represent a constraint or relationship between the 'xs' and 'ys' parameters. The green dots could indicate the best-fit parameters or a specific observation. The arrows might indicate the direction of increasing likelihood or a gradient in the parameter space. The different "Wide" and "Close" plots suggest a multi-scale analysis, where "Wide" plots explore broader parameter ranges and "Close" plots focus on specific regions. The changing shape of the red contour across the plots indicates how the parameter space changes under different conditions or scales.