## Chart: KMT-2016-BLG-1105 Microlensing Event Light Curves
### Overview
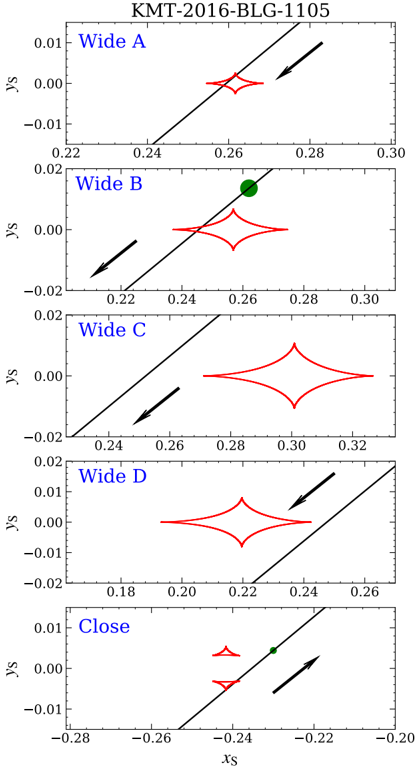
The image presents five separate light curves, each representing a different observation or "view" of the same microlensing event, KMT-2016-BLG-1105. Each light curve plots the change in position (Ys) against the change in position (Xs) over time, likely representing the deflection of light from a background star by a foreground lensing object. Each subplot is labeled "Wide A", "Wide B", "Wide C", "Wide D", and "Close", suggesting different observing conditions or telescopes. Each light curve also includes a linear trend line and a marker (green triangle or red arrow) indicating a specific point of interest.
### Components/Axes
* **Title:** KMT-2016-BLG-1105 (top-right)
* **X-axis Label:** Xs (bottom)
* **Y-axis Label:** Ys (left)
* **Subplot Labels:** Wide A, Wide B, Wide C, Wide D, Close (top-left of each subplot)
* **Linear Trend Lines:** Black lines in each subplot.
* **Data Points:** Red lines representing the light curve data.
* **Markers:** Green triangles and red arrows indicating specific points.
### Detailed Analysis or Content Details
**Wide A:**
* X-axis range: approximately 0.22 to 0.30
* Y-axis range: approximately -0.01 to 0.01
* The light curve shows a roughly symmetrical peak.
* A green triangle is located at approximately (Xs = 0.26, Ys = 0.00).
* The linear trend line has a positive slope.
**Wide B:**
* X-axis range: approximately 0.22 to 0.30
* Y-axis range: approximately -0.02 to 0.00
* The light curve shows a peak, but it is less pronounced than in Wide A.
* A green triangle is located at approximately (Xs = 0.26, Ys = -0.005).
* The linear trend line has a positive slope.
**Wide C:**
* X-axis range: approximately 0.24 to 0.32
* Y-axis range: approximately -0.02 to 0.02
* The light curve shows a clear peak.
* A green triangle is located at approximately (Xs = 0.28, Ys = 0.01).
* The linear trend line has a positive slope.
**Wide D:**
* X-axis range: approximately 0.18 to 0.26
* Y-axis range: approximately -0.01 to 0.01
* The light curve shows a peak.
* A green triangle is located at approximately (Xs = 0.22, Ys = -0.005).
* The linear trend line has a positive slope.
**Close:**
* X-axis range: approximately -0.28 to -0.20
* Y-axis range: approximately -0.01 to 0.01
* The light curve shows a peak.
* A red arrow is located at approximately (Xs = -0.24, Ys = 0.005).
* The linear trend line has a positive slope.
### Key Observations
* All light curves exhibit a peak, indicating a microlensing event.
* The peaks vary in amplitude and shape across the different observations.
* The green triangles consistently appear near the peak of the light curves.
* The "Close" light curve has a negative X-axis range, suggesting a different coordinate system or orientation.
* The linear trend lines are consistently positive, indicating a general upward trend in the data.
### Interpretation
The image depicts the light curves from a microlensing event, KMT-2016-BLG-1105. Microlensing occurs when a massive object (the lens) passes between a distant source star and the Earth, bending the light from the source and causing it to appear brighter. The different "Wide" and "Close" observations likely represent data taken with different telescopes or observing strategies, providing a more complete picture of the event.
The peaks in the light curves represent the maximum magnification of the source star due to the lensing effect. The variations in peak amplitude and shape suggest that the lensing object may have a complex structure or that the alignment between the source, lens, and Earth was not perfect. The green triangles likely mark the point of maximum magnification or a key feature in the light curve. The "Close" observation, with its negative X-axis values, may represent a different coordinate system or a zoomed-in view of the event.
The consistent positive slope of the linear trend lines suggests a systematic effect or a long-term trend in the data. This could be due to instrumental effects, atmospheric conditions, or a real physical phenomenon. Further analysis would be needed to determine the cause of this trend. The data suggests a microlensing event with variations in the lensing effect observed from different perspectives.