## Line Graphs: Percentage of Properties Verified Over Computation Time
### Overview
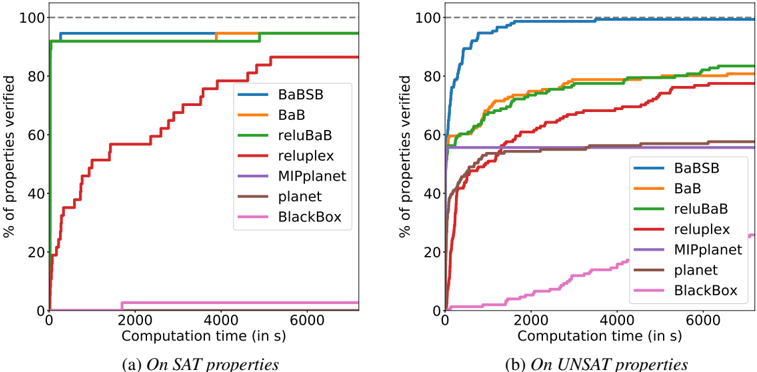
The image contains two line graphs comparing the performance of various algorithms in verifying properties over computation time. Graph (a) focuses on SAT properties, while graph (b) focuses on UNSAT properties. Each graph tracks the percentage of properties verified against computation time (in seconds) for seven algorithms: BaBSB, BaB, reluBaB, reluplex, MIPplanet, planet, and BlackBox.
### Components/Axes
- **X-axis**: Computation time (in seconds), ranging from 0 to 6,000s.
- **Y-axis**: % of properties verified, ranging from 0% to 100%.
- **Legends**: Located on the right side of each graph, with colors mapped to algorithms:
- BaBSB: Blue
- BaB: Orange
- reluBaB: Green
- reluplex: Red
- MIPplanet: Purple
- planet: Brown
- BlackBox: Pink
- **Graph Labels**:
- (a) On SAT properties
- (b) On UNSAT properties
### Detailed Analysis
#### Graph (a): On SAT properties
- **BaBSB (Blue)**: Starts at ~95% and remains flat at ~100% after ~500s.
- **BaB (Orange)**: Starts at ~85% and plateaus at ~95% after ~1,000s.
- **reluBaB (Green)**: Starts at ~90% and stabilizes at ~95% after ~1,000s.
- **reluplex (Red)**: Starts at ~20% and rises to ~85% by ~6,000s.
- **MIPplanet (Purple)**: Starts at ~50% and increases to ~65% by ~6,000s.
- **planet (Brown)**: Starts at ~40% and rises to ~55% by ~6,000s.
- **BlackBox (Pink)**: Remains at 0% throughout.
#### Graph (b): On UNSAT properties
- **BaBSB (Blue)**: Starts at ~90% and plateaus at ~100% after ~500s.
- **BaB (Orange)**: Starts at ~60% and rises to ~80% by ~6,000s.
- **reluBaB (Green)**: Starts at ~65% and increases to ~85% by ~6,000s.
- **reluplex (Red)**: Starts at ~40% and rises to ~75% by ~6,000s.
- **MIPplanet (Purple)**: Starts at ~55% and increases to ~60% by ~6,000s.
- **planet (Brown)**: Starts at ~50% and rises to ~55% by ~6,000s.
- **BlackBox (Pink)**: Starts at ~10% and rises to ~20% by ~6,000s.
### Key Observations
1. **SAT Properties (Graph a)**:
- BaBSB, BaB, and reluBaB achieve near-complete verification (95–100%) within ~1,000s.
- reluplex, MIPplanet, and planet show slower progress, reaching ~55–85% by ~6,000s.
- BlackBox fails to verify any properties.
2. **UNSAT Properties (Graph b)**:
- BaBSB again achieves near-complete verification (~100%) quickly.
- BaB, reluBaB, and reluplex show gradual improvement, reaching ~75–85% by ~6,000s.
- MIPplanet and planet show minimal progress (~55–60%).
- BlackBox improves slightly but remains low (~20%).
### Interpretation
- **Algorithm Efficiency**: BaBSB consistently outperforms others in both SAT and UNSAT scenarios, suggesting superior optimization for property verification.
- **SAT vs. UNSAT**: Algorithms like reluplex and reluBaB perform better on SAT properties, while UNSAT requires more computation time for similar results.
- **BlackBox Anomaly**: Its inability to verify properties (SAT) or minimal progress (UNSAT) may indicate design limitations or incompatibility with the tested tasks.
- **Scalability**: Most algorithms struggle to reach 100% verification for UNSAT properties within 6,000s, highlighting computational complexity challenges.
The data suggests that algorithm choice significantly impacts verification efficiency, with BaBSB being the most robust performer across both property types.