## Diagram: Knowledge Graph Evolution
### Overview
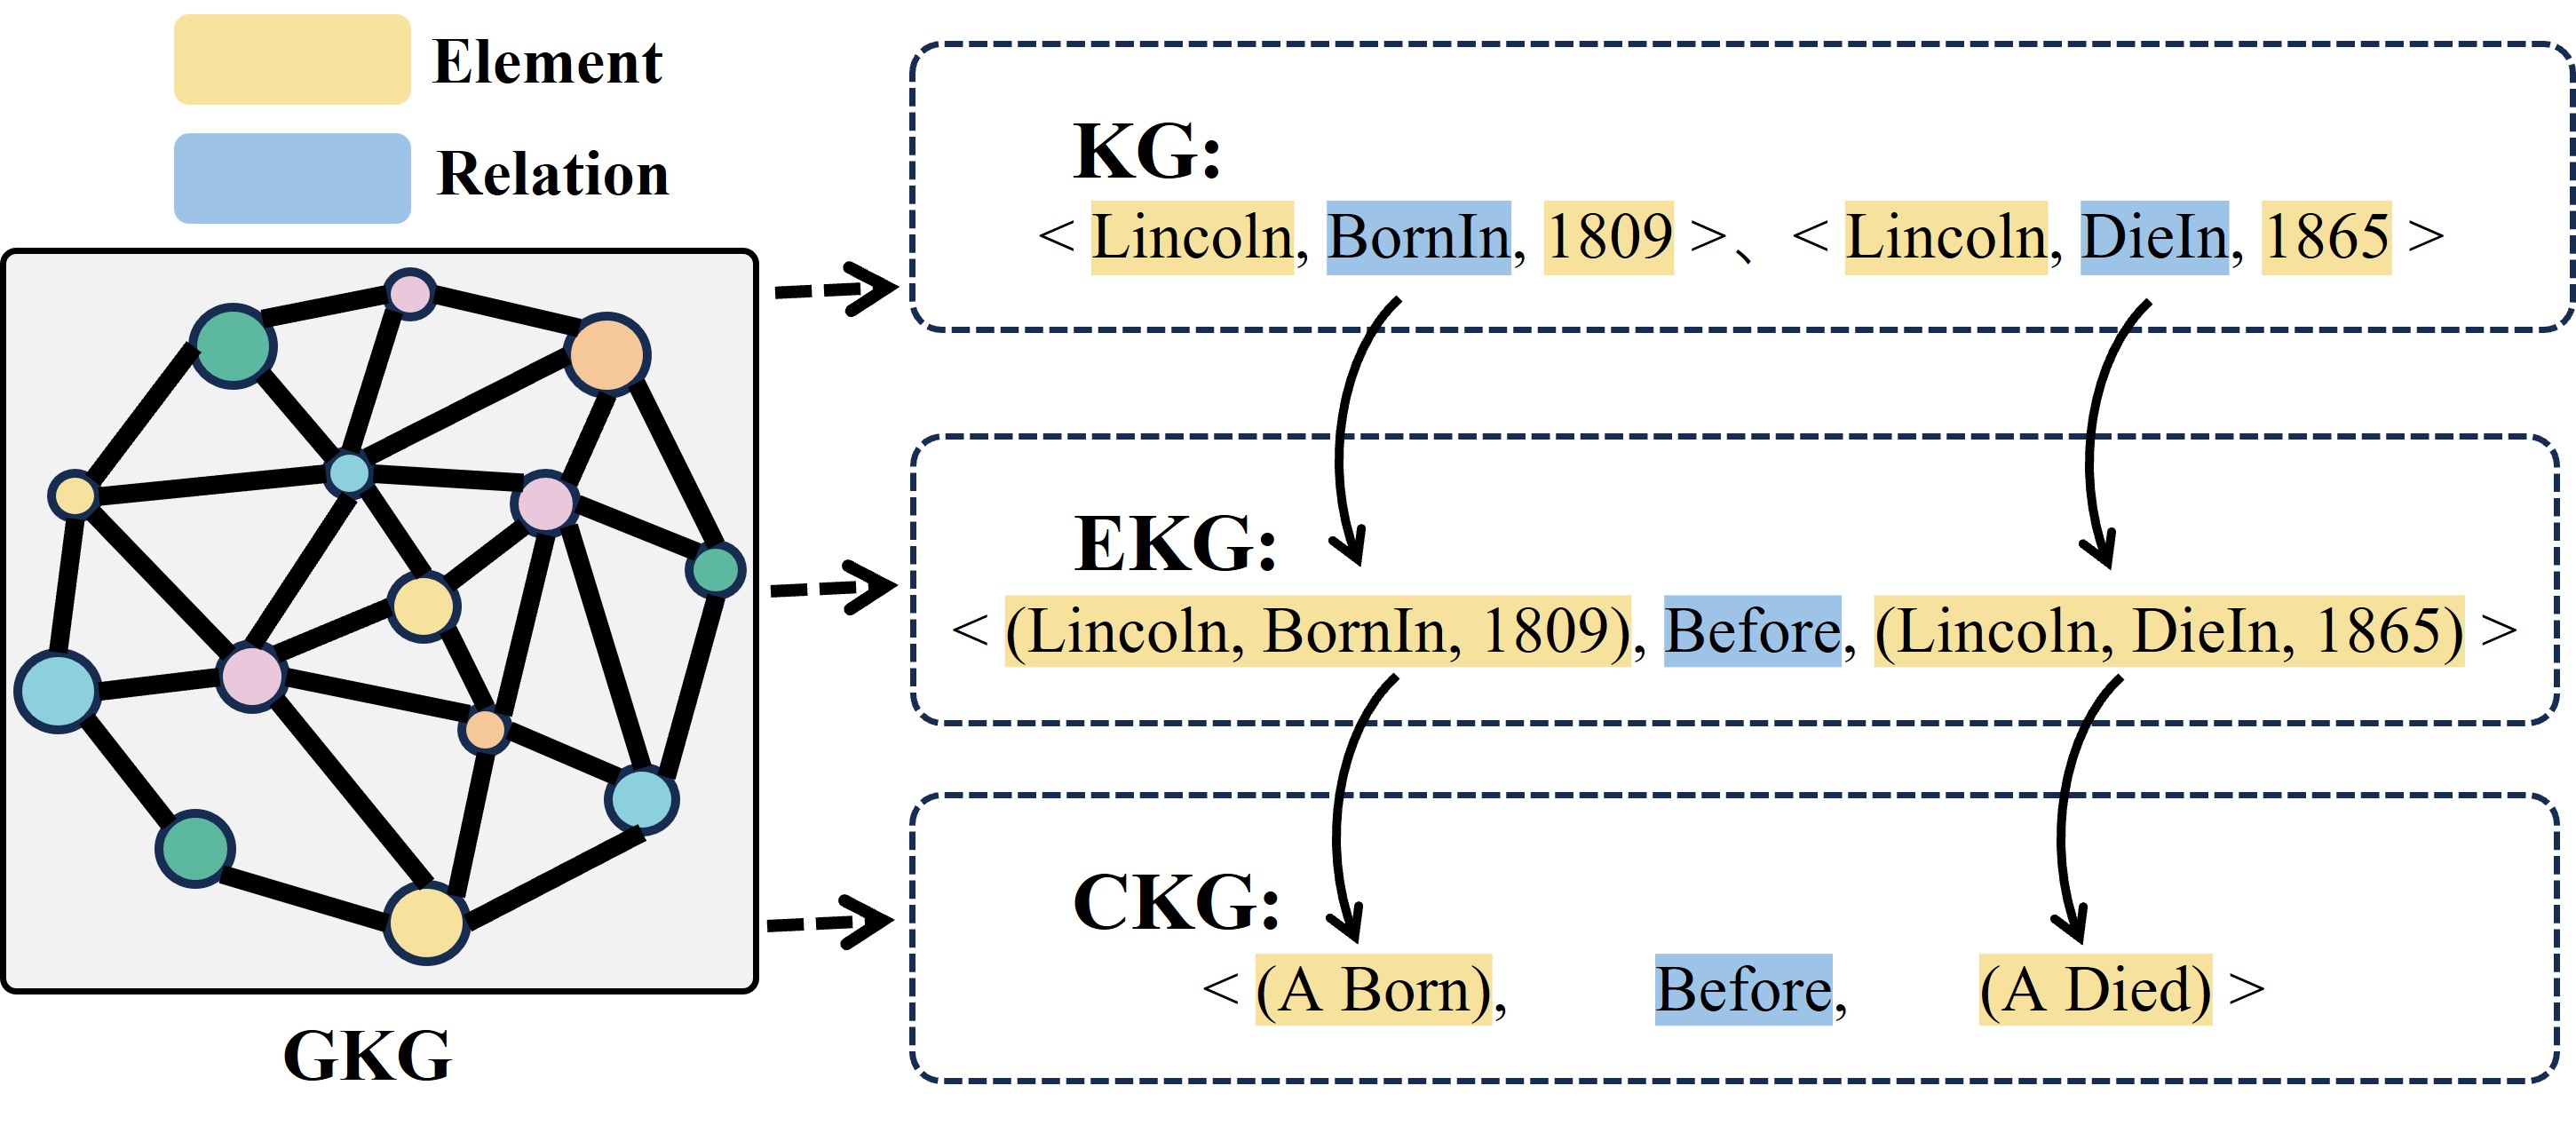
The image illustrates the evolution of a knowledge graph (KG) through two intermediate stages: an Event Knowledge Graph (EKG) and a Conceptual Knowledge Graph (CKG). It shows how raw data in the KG is transformed into more structured and abstract representations in the EKG and CKG, respectively. The diagram uses nodes and edges to represent entities and relations, with color-coding to distinguish between elements and relations.
### Components/Axes
* **Legend (Top-Left)**:
* Yellow: Element
* Blue: Relation
* **GKG (Bottom-Left)**: A complex graph with multiple nodes (colored in yellow, blue, pink, and green) connected by black lines. The nodes represent elements, and the lines represent relations.
* **KG (Top-Right)**: Knowledge Graph. Contains the following data:
* `<Lincoln, BornIn, 1809>`
* `<Lincoln, DieIn, 1865>`
* **EKG (Middle-Right)**: Event Knowledge Graph. Contains the following data:
* `<(Lincoln, BornIn, 1809), Before, (Lincoln, DieIn, 1865)>`
* **CKG (Bottom-Right)**: Conceptual Knowledge Graph. Contains the following data:
* `<(A Born), Before, (A Died)>`
* **Arrows**: Black arrows indicate the flow of information from GKG to KG, from KG to EKG, and from EKG to CKG.
### Detailed Analysis
* **GKG**: The GKG is a dense network of interconnected nodes. The nodes are colored yellow, blue, pink, and green, suggesting different categories of elements. The edges (black lines) represent the relationships between these elements.
* **KG**: The KG represents factual knowledge about Lincoln's birth and death. The elements "Lincoln," "1809," and "1865" are colored yellow, indicating they are elements. The relations "BornIn" and "DieIn" are colored blue, indicating they are relations.
* **EKG**: The EKG represents an event-based knowledge structure. It combines the birth and death events of Lincoln and relates them using the "Before" relation.
* **CKG**: The CKG represents a conceptual abstraction of the events. It generalizes the birth and death events to "A Born" and "A Died," respectively, maintaining the "Before" relation.
### Key Observations
* The diagram shows a progression from a complex, unstructured graph (GKG) to more structured and abstract knowledge representations (KG, EKG, CKG).
* The color-coding consistently distinguishes between elements (yellow) and relations (blue).
* The arrows indicate a clear flow of information and abstraction from the initial graph to the final conceptual representation.
### Interpretation
The diagram illustrates a process of knowledge extraction and abstraction. The GKG likely represents a raw, unstructured data source. The KG extracts specific facts from this source. The EKG organizes these facts into event-based structures, and the CKG further abstracts these events into conceptual representations. This process demonstrates how knowledge can be refined and generalized from raw data to higher-level concepts. The evolution from GKG to CKG represents a shift from specific instances to general concepts, which is a key aspect of knowledge representation and reasoning.