## Heatmap: Number of Iterations vs. Amount of Collapse
### Overview
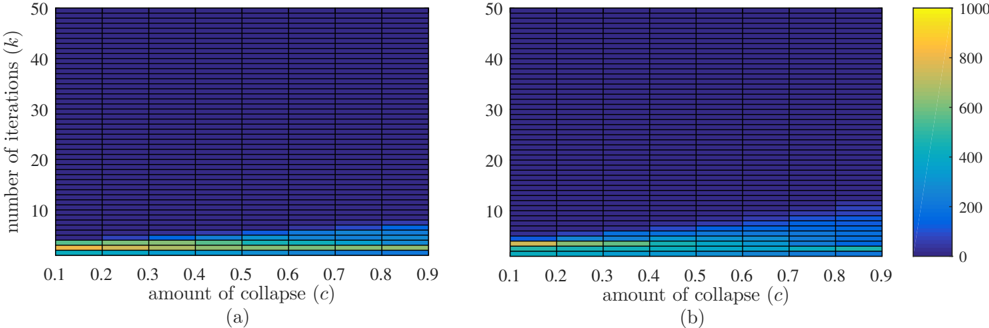
The image presents two heatmaps, labeled (a) and (b), visualizing the relationship between the number of iterations (k) and the amount of collapse (c). The color intensity represents a third, unspecified variable, ranging from 0 (dark blue) to 1000 (yellow). Both heatmaps share the same axes and color scale.
### Components/Axes
* **X-axis (Horizontal):** "amount of collapse (c)". Values range from 0.1 to 0.9 in increments of 0.1.
* **Y-axis (Vertical):** "number of iterations (k)". Values range from 0 to 50 in increments of 10.
* **Color Scale (Legend):** Located on the right side of the image. The scale ranges from 0 (dark blue) to 1000 (yellow). Intermediate colors include shades of blue, green, and yellow.
* **Heatmap Labels:** The heatmaps are labeled as "(a)" and "(b)" below the x-axis.
### Detailed Analysis
**Heatmap (a):**
* The heatmap is predominantly dark blue, indicating low values.
* A thin band of yellow/green is visible for the first few iterations (k < 5) across all values of 'c'.
* The intensity of the yellow/green band appears relatively consistent across the range of 'c' values.
**Heatmap (b):**
* Similar to heatmap (a), the heatmap is predominantly dark blue.
* A thin band of yellow/green is visible for the first few iterations (k < 5) across all values of 'c'.
* The intensity of the yellow/green band appears to increase slightly as 'c' increases from 0.1 to 0.9.
* There is a slight increase in the number of iterations that are not dark blue as 'c' increases.
### Key Observations
* Both heatmaps show a similar pattern: low values for most combinations of 'k' and 'c', with higher values concentrated at low iteration numbers.
* Heatmap (b) shows a slightly higher intensity and spread of higher values compared to heatmap (a), especially at higher 'c' values.
### Interpretation
The heatmaps visualize the effect of the "amount of collapse (c)" on some unspecified variable as the "number of iterations (k)" increases. The data suggests that a higher amount of collapse may lead to slightly higher values of the unspecified variable, especially at lower iteration numbers. The difference between heatmaps (a) and (b) suggests that there is some difference in the underlying process or parameters between the two scenarios. The nature of the unspecified variable and the specific differences between the scenarios would need further context to fully understand.