\n
## Heatmap: Iteration Count vs. Collapse Amount
### Overview
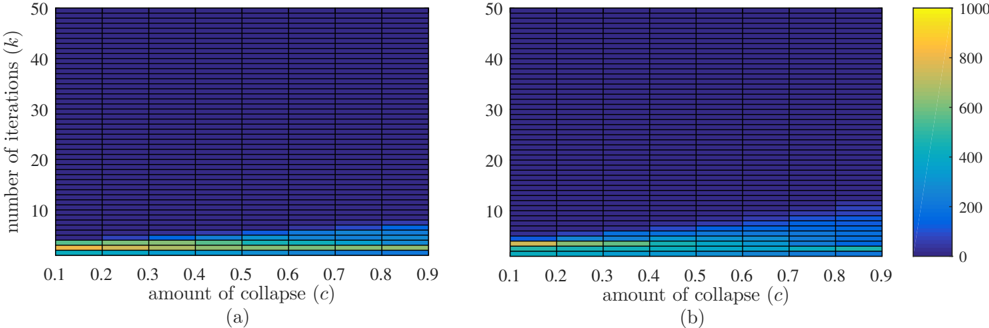
The image presents two heatmaps, labeled (a) and (b), visualizing the relationship between the "amount of collapse" (c) and the "number of iterations" (k). Both heatmaps share the same axes scales. The color intensity represents a numerical value, indicated by a colorbar on the right, ranging from approximately 0 to 1000.
### Components/Axes
* **X-axis:** "amount of collapse (c)", ranging from 0.1 to 0.9, with increments of approximately 0.1.
* **Y-axis:** "number of iterations (k)", ranging from 0 to 50, with increments of 10.
* **Colorbar:** Located on the right side of the image, representing values from 0 (dark blue) to 1000 (bright yellow).
* **Labels:** (a) and (b) are labels for the two heatmaps.
### Detailed Analysis or Content Details
**Heatmap (a):**
* The heatmap shows a predominantly dark blue color across the entire range of "amount of collapse" and "number of iterations".
* A thin band of color, transitioning from green to yellow, appears along the bottom edge of the heatmap, corresponding to low values of "number of iterations" (k) between 0 and approximately 10.
* The values within this band are approximately between 0 and 200.
* The color intensity remains consistently low (dark blue) for higher values of "number of iterations" (k).
**Heatmap (b):**
* Similar to heatmap (a), this heatmap also displays a predominantly dark blue color.
* However, the band of color along the bottom edge is more pronounced and extends to higher values.
* The color transitions from dark blue to green, then to yellow, indicating increasing values.
* The maximum value in this band reaches approximately 1000 at the rightmost edge (amount of collapse = 0.9) and low iteration counts (k < 10).
* As the "number of iterations" (k) increases, the color intensity decreases, transitioning back to dark blue.
* The values within this band are approximately between 0 and 1000.
### Key Observations
* Both heatmaps exhibit a strong dependence on the "number of iterations" (k). Higher iteration counts generally correspond to lower values.
* Heatmap (b) shows a more significant variation in values, particularly at lower iteration counts, compared to heatmap (a).
* The "amount of collapse" (c) appears to have a more pronounced effect on the values in heatmap (b) than in heatmap (a).
* The color bands are horizontal, indicating that the value is primarily determined by the number of iterations.
### Interpretation
The data suggests that the process being modeled requires a certain number of iterations to reach a stable state. The "amount of collapse" (c) likely represents a parameter influencing the rate or extent of this stabilization.
* **Heatmap (a)** indicates a relatively stable process, with values remaining low regardless of the "amount of collapse". This could mean the process is robust to changes in this parameter.
* **Heatmap (b)** demonstrates a more sensitive relationship. At low iteration counts, the "amount of collapse" significantly impacts the value, reaching a maximum at c = 0.9. As the number of iterations increases, the effect of the "amount of collapse" diminishes, and the value converges towards a lower, stable state.
The difference between the two heatmaps could be due to different initial conditions, parameters, or algorithms used in the modeling process. The colorbar indicates that the values represent some measure of error, cost, or convergence rate. The horizontal bands suggest that the system converges to a stable state as the number of iterations increases, and the amount of collapse influences the initial stages of this convergence.