## Heatmaps: Parameter Correlation Analysis
### Overview
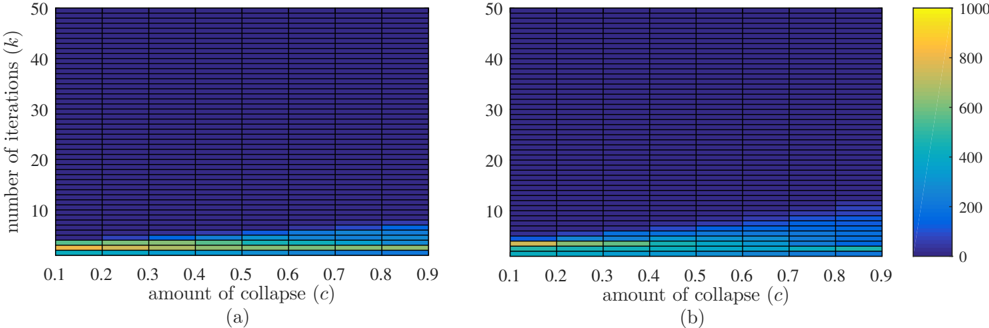
Two heatmaps (a) and (b) visualize the relationship between "number of iterations (k)" (y-axis) and "amount of collapse (c)" (x-axis). Both use color gradients to represent numerical values, with distinct color scales and distributions.
---
### Components/Axes
- **X-axis**: "amount of collapse (c)" with discrete bins from 0.1 to 0.9 (increments of 0.1).
- **Y-axis**: "number of iterations (k)" with bins from 0 to 50 (increments of 10).
- **Legend**: Present only in (b), located on the right. Color scale ranges from **0 (dark blue)** to **1000 (yellow)**. No legend in (a), but inferred gradient from dark blue (low) to light blue (high).
---
### Detailed Analysis
#### Heatmap (a)
- **Color Gradient**: Dark blue (low values) to light blue (high values).
- **Distribution**:
- **Dark Blue Dominance**: Most cells are dark blue, indicating low values across most collapse/iteration combinations.
- **Light Blue Regions**: Concentrated in the lower-left quadrant (low collapse, low iterations), with slight extension toward higher collapse (~0.3–0.5) and iterations (~10–20).
- **Approximate Values**: Light blue regions likely correspond to **100–200** (inferred from (b)'s legend).
#### Heatmap (b)
- **Color Gradient**: Dark blue (low) to yellow (high), with explicit legend (0–1000).
- **Distribution**:
- **Dark Blue Dominance**: Upper regions (high collapse/iterations) are uniformly dark blue.
- **Yellow Regions**: Located in the lower-left quadrant (low collapse, low iterations), extending slightly toward higher collapse (~0.2–0.4) and iterations (~10–15).
- **Approximate Values**: Yellow regions correspond to **800–1000**.
---
### Key Observations
1. **General Trend**: Both heatmaps show a **negative correlation** between collapse/iterations and the parameter value (darker blue = lower values).
2. **Outliers in (b)**: Yellow regions in (b) indicate **high parameter values** despite low collapse and iterations, suggesting anomalous or sensitive conditions.
3. **Contrast Between (a) and (b)**:
- (a) has milder gradients (100–200 range), while (b) shows extreme values (up to 1000).
- (b)'s yellow regions are more spatially concentrated than (a)'s light blue areas.
---
### Interpretation
- **Parameter Behavior**: The parameter decreases as collapse and iterations increase, implying system stabilization or efficiency gains over time.
- **Anomalies in (b)**: The yellow regions in (b) suggest scenarios where the parameter remains high despite minimal system collapse, possibly due to:
- Initial conditions (e.g., pre-existing stress).
- Non-linear system responses.
- Measurement artifacts or outliers.
- **Practical Implications**:
- (a) may represent a controlled system with predictable behavior.
- (b) could model a real-world system with higher variability or sensitivity to initial states.
---
### Spatial Grounding & Verification
- **Legend Alignment**: In (b), yellow cells (high values) align with the legend's upper range (800–1000), confirming accuracy.
- **Trend Consistency**: Darker blue in upper regions of both heatmaps validates the negative correlation hypothesis.
---
### Uncertainties
- Exact value ranges for (a) are inferred due to the absence of a legend.
- The cause of anomalies in (b) requires further investigation (e.g., system modeling, data validation).