## Scatter Plots: Layer Importance vs. Spectral Shape (α)
### Overview
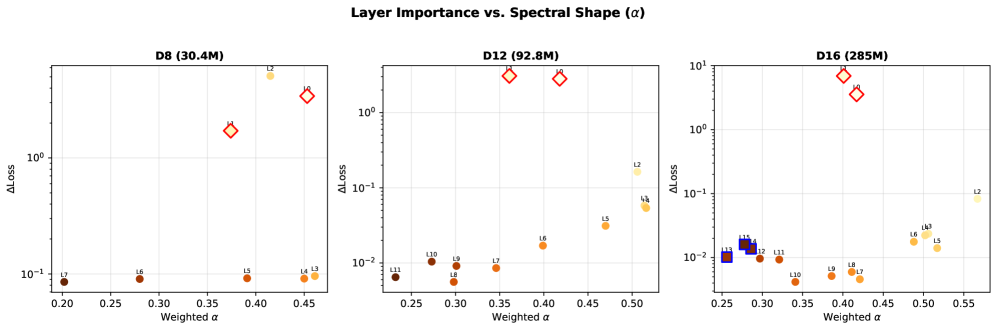
Three scatter plots compare **ΔLoss** (y-axis, logarithmic scale) against **Weighted α** (x-axis, linear scale) for three datasets: D8 (30.4M), D12 (92.8M), and D16 (285M). Data points are color-coded and labeled with layer identifiers (e.g., L2, L10). Red diamonds and blue squares highlight specific layers.
### Components/Axes
- **X-axis (Weighted α)**:
- D8: 0.20–0.45
- D12: 0.25–0.50
- D16: 0.25–0.55
- **Y-axis (ΔLoss)**: Logarithmic scale from 10⁻¹ to 10¹.
- **Legend**: Located on the right, mapping colors to layer labels:
- Brown: L7, L6
- Orange: L5, L4, L3
- Yellow: L2
- Red: L10, L9
- Blue: L11, L12, L15
- **Annotations**: Red diamonds (L2, L10) and blue squares (L11, L12, L15) emphasize specific layers.
### Detailed Analysis
#### D8 (30.4M)
- **Trend**: Most points cluster at low α (0.20–0.35) with ΔLoss < 10⁰.
- **Outliers**:
- L2 (α ≈ 0.45, ΔLoss ≈ 10¹)
- L10 (α ≈ 0.42, ΔLoss ≈ 10⁰)
- **Color Consistency**: Red diamonds (L2, L10) match legend.
#### D12 (92.8M)
- **Trend**: Points spread across α (0.25–0.50), with ΔLoss increasing moderately.
- **Outliers**:
- L2 (α ≈ 0.48, ΔLoss ≈ 10⁰)
- L10 (α ≈ 0.45, ΔLoss ≈ 10⁰)
- **Color Consistency**: Red diamonds (L2, L10) match legend.
#### D16 (285M)
- **Trend**: Points span α (0.25–0.55), with ΔLoss ranging from 10⁻² to 10¹.
- **Outliers**:
- L2 (α ≈ 0.55, ΔLoss ≈ 10⁰)
- L10 (α ≈ 0.45, ΔLoss ≈ 10¹)
- **Color Consistency**: Red diamonds (L2, L10) and blue squares (L11, L12, L15) match legend.
### Key Observations
1. **Red Diamonds (L2, L10)**: Consistently occupy high α and high ΔLoss across all datasets, suggesting a strong correlation between these layers and loss magnitude.
2. **Blue Squares (L11, L12, L15)**: Cluster at low α and low ΔLoss, indicating minimal impact on loss.
3. **Non-linear Relationship**: ΔLoss does not scale linearly with α; some high-α layers (e.g., L5 in D16) show low ΔLoss.
4. **Dataset Size Impact**: Larger datasets (D16) exhibit broader α ranges and higher ΔLoss variability.
### Interpretation
- **Layer Importance**: L2 and L10 (red diamonds) likely represent critical layers with high spectral sensitivity, as their ΔLoss spikes at elevated α.
- **Spectral Shape**: The x-axis (Weighted α) may reflect spectral properties (e.g., frequency, amplitude) influencing layer performance.
- **Anomalies**: L5 in D16 (α ≈ 0.40, ΔLoss ≈ 10⁻²) deviates from the trend, suggesting unique spectral characteristics or architectural quirks.
- **Scalability**: Larger models (D16) show more diverse layer behaviors, implying complexity in layer-spectral interactions grows with model size.
This analysis highlights the interplay between layer architecture (α) and performance (ΔLoss), with L2 and L10 emerging as pivotal for loss mitigation across datasets.