## Contour Plot: Level Sets of Ωε(x₁, x₂)
### Overview
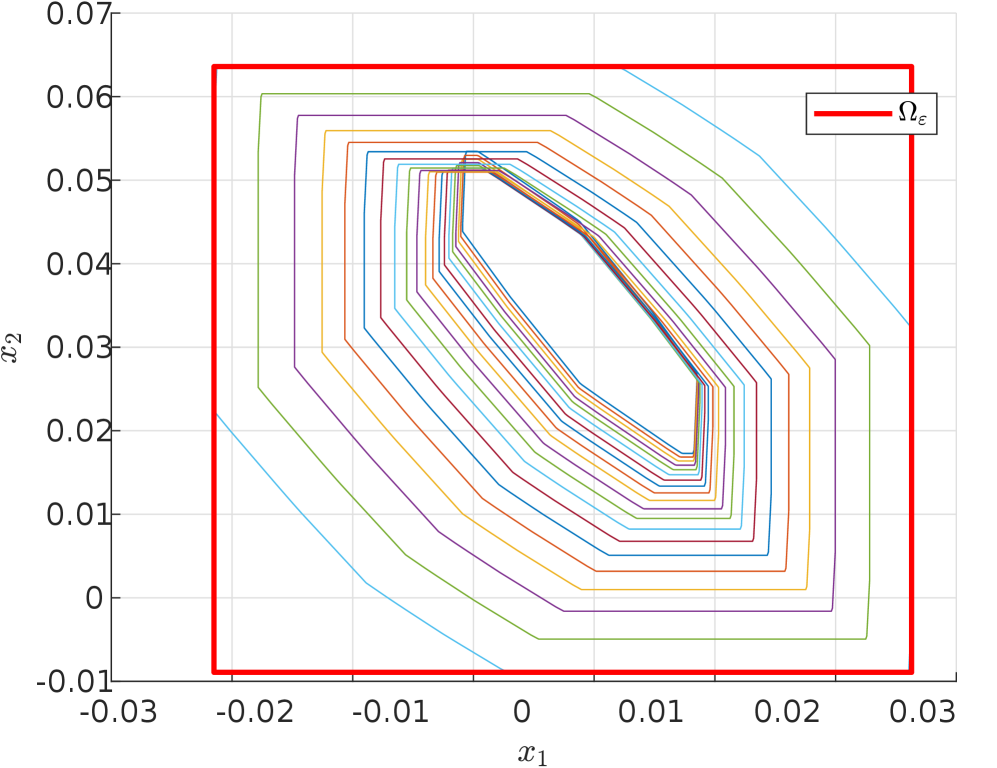
The image depicts a contour plot of a two-dimensional function Ωε(x₁, x₂), represented by nested polygonal lines. The outermost contour is a red square labeled Ωε, while inner contours form increasingly complex polygons with varying numbers of sides. The plot spans x₁ ∈ [-0.03, 0.03] and x₂ ∈ [-0.01, 0.07], with contour lines denser near the origin (0,0).
### Components/Axes
- **Axes**:
- **x₁ (horizontal)**: Ranges from -0.03 to 0.03, labeled at intervals of 0.01.
- **x₂ (vertical)**: Ranges from -0.01 to 0.07, labeled at intervals of 0.01.
- **Legend**: Located in the top-right corner, explicitly labeling the red contour as Ωε. No other legend entries are visible.
- **Contour Lines**:
- **Ωε (red)**: Forms a square boundary at the plot's perimeter.
- **Inner contours**: Progressively smaller polygons (octagons, decagons, etc.) with colors transitioning from purple to green to blue as they approach the center.
### Detailed Analysis
1. **Ωε Contour (Red)**:
- Forms a perfect square with vertices at (±0.03, ±0.07).
- Acts as the maximum boundary for Ωε.
2. **Inner Contours**:
- **Color progression**: Purple → Orange → Red → Blue → Green (approximate, based on visual gradient).
- **Shape evolution**: Square → Octagon → Decagon → Irregular polygons → Near-circular shapes near the origin.
- **Spacing**: Contours are evenly spaced in the outer regions but become denser (closer together) as they approach the center, suggesting a steeper gradient of Ωε near (0,0).
3. **Symmetry**:
- The plot exhibits approximate symmetry about both axes, though the x₂ range is asymmetric (positive bias).
### Key Observations
- **Convergence to Origin**: All contours collapse to a single point at (0,0), indicating a critical point (likely a minimum or saddle point) for Ωε.
- **Shape Transition**: The shift from regular polygons to irregular shapes near the center suggests a nonlinear relationship between Ωε and spatial coordinates.
- **Asymmetry in x₂**: The upper x₂ limit (0.07) is twice the lower limit (-0.01), potentially reflecting boundary conditions or domain constraints.
### Interpretation
The plot visualizes level sets of Ωε, where each contour represents a constant value of the function. The red Ωε contour defines the domain's outer boundary, while inner contours map regions of decreasing Ωε values. The convergence to a point at the origin implies a singularity or extremum there. The transition from square to rounded contours may indicate a change in the function's curvature or interaction with domain boundaries. The lack of labeled inner contours prevents quantitative analysis, but the spatial density suggests Ωε varies most rapidly near the origin. This structure is typical of potential fields, stress distributions, or optimization landscapes in technical applications.